Identity Details🔗
Identity Details provides pertinent information about the identity based on the data collected from your Identity Provider as well as observations across your Secureworks® Taegis™ XDR data sources.
To view Identity Details, select the Display Name from the top of a card or from the table on the Identities view of the Directory page.
Identity details are organized into the following tabs:
Summary Tab🔗
The Summary tab presents the following identity information:
Details🔗
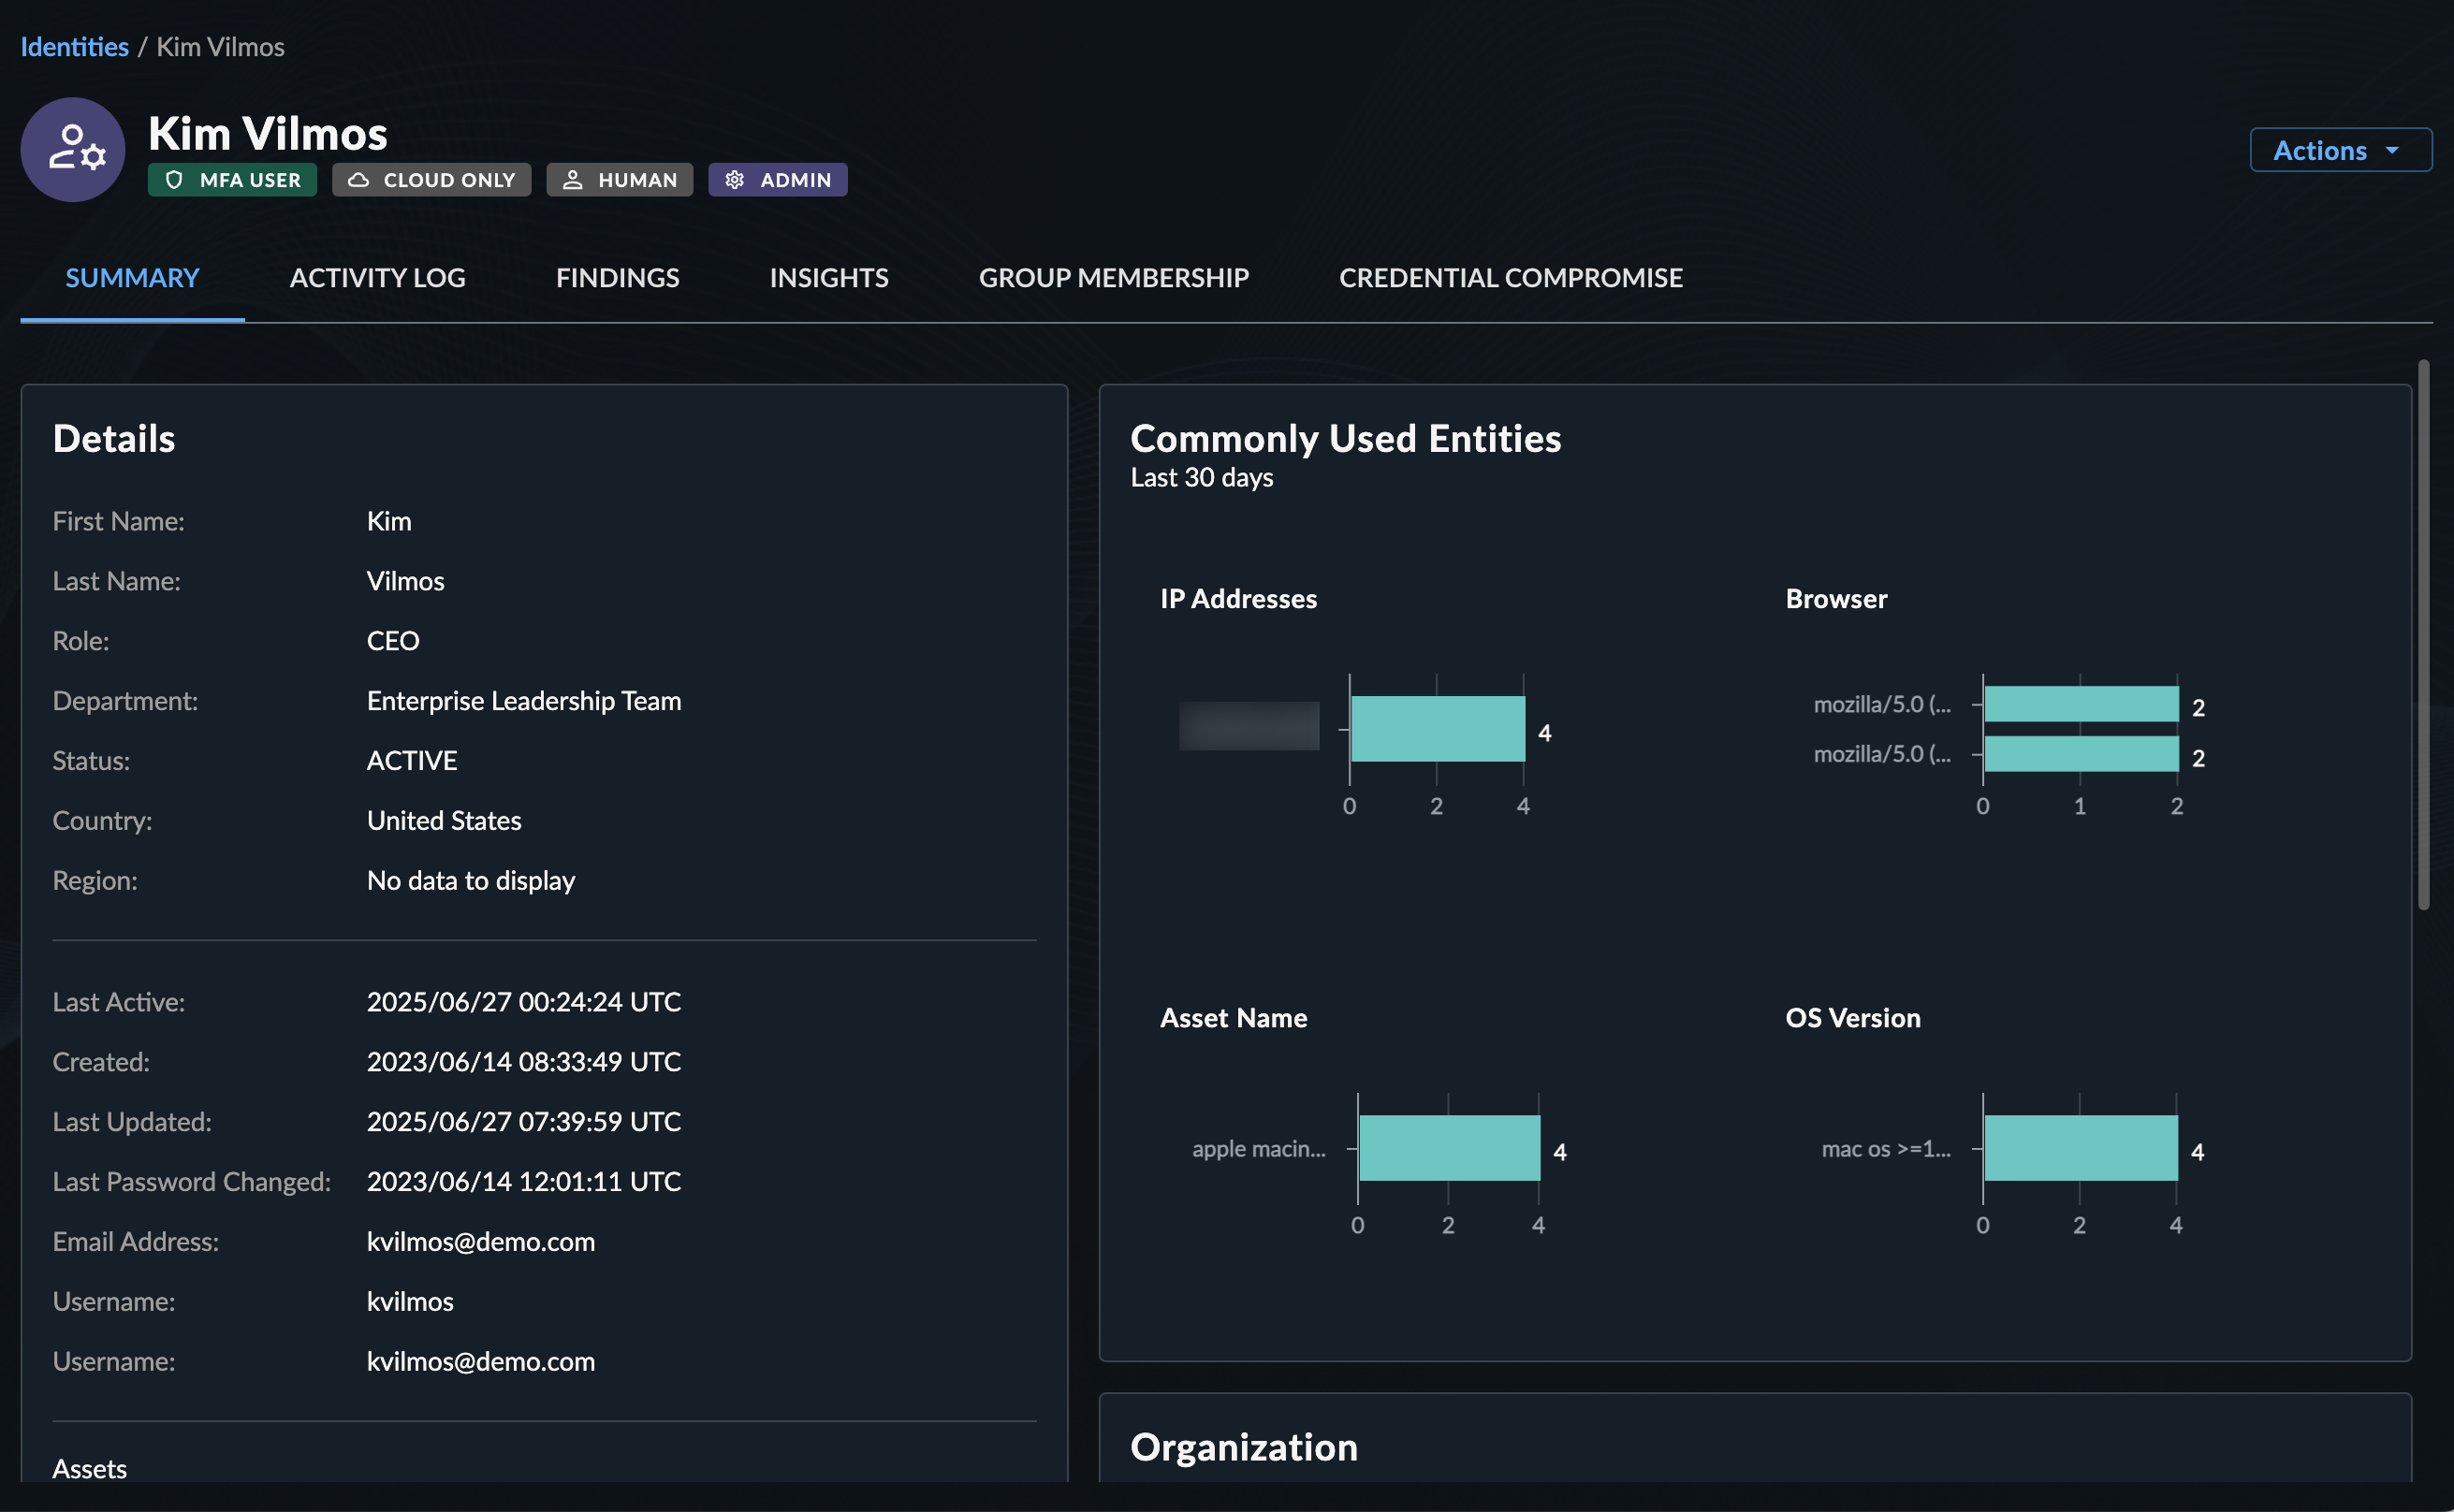
The Details section contains details about the identity as available from your Microsoft Entra ID environment. This includes information about their role, department, status, country, and region. Additionally included are details of when their account was created and updated, the last password change time, and other related email addresses associated with the user.
Related Devices🔗
The Related Devices section contains Intune devices that are associated to the user within Microsoft Entra ID.
Multi-Factor Authentication🔗
The Multi-Factor Authentication (MFA) section contains details about the MFA configuration of the user, such as the MFA provider, primary MFA method, and any other MFA types configured.
Recent Detections and Cases🔗
The Recent Detections and Cases section contains tabs with the following information:
- Open Detections: Open detections within the past seven days for the identity.
- Closed Detections: Closed detections within the past 30 days for the identity.
- Cases: Open or closed cases within the past 30 days for the identity.
Select the View All button from within Recent Detections and Cases to navigate to the Insights tab.
Risk Score🔗
The Risk Score section shows the identity's current Risk Score and the top factors contributing to the score. For details of how scores are calculated and how to improve them, see Identity Risk Score.
Top Sign-in Locations🔗
The Top Sign-in Locations section maps the user’s top sign-in locations, including counts and breakdowns by public and private IP activity. Click View Details to see a breakdown of the top IP addresses used for authentication in the last 30 days, including geographic location, ASN, frequency, and filters for IP type and login outcome.
Commonly Used Entities🔗
The Commonly Used Entities section provides insights into some of the attributes related to successful authentications over the last 30 days. This helps you understand the profile of the user and what is common or abnormal. The following graphs display when we have data for the user:
- IP Addresses: The IP addresses that we have observed the user successfully authenticating from.
- Browser: The user-agents that we have observed the user successfully authenticating from.
- Asset Name: The types of assets that we have observed the user successfully authenticating from.
- OS Version: The operating system version that we have observed the user successfully authenticating from.
Organization🔗
The Organization section provides a snapshot of the identity's reporting structure. This allows you to see who the individual reports to and whether or not they also have direct reports. This is useful when investigating threats or formulating a risk assessment of the user and its related activity. Click the organization chart to open other users in a new window.
Activity Log Tab🔗
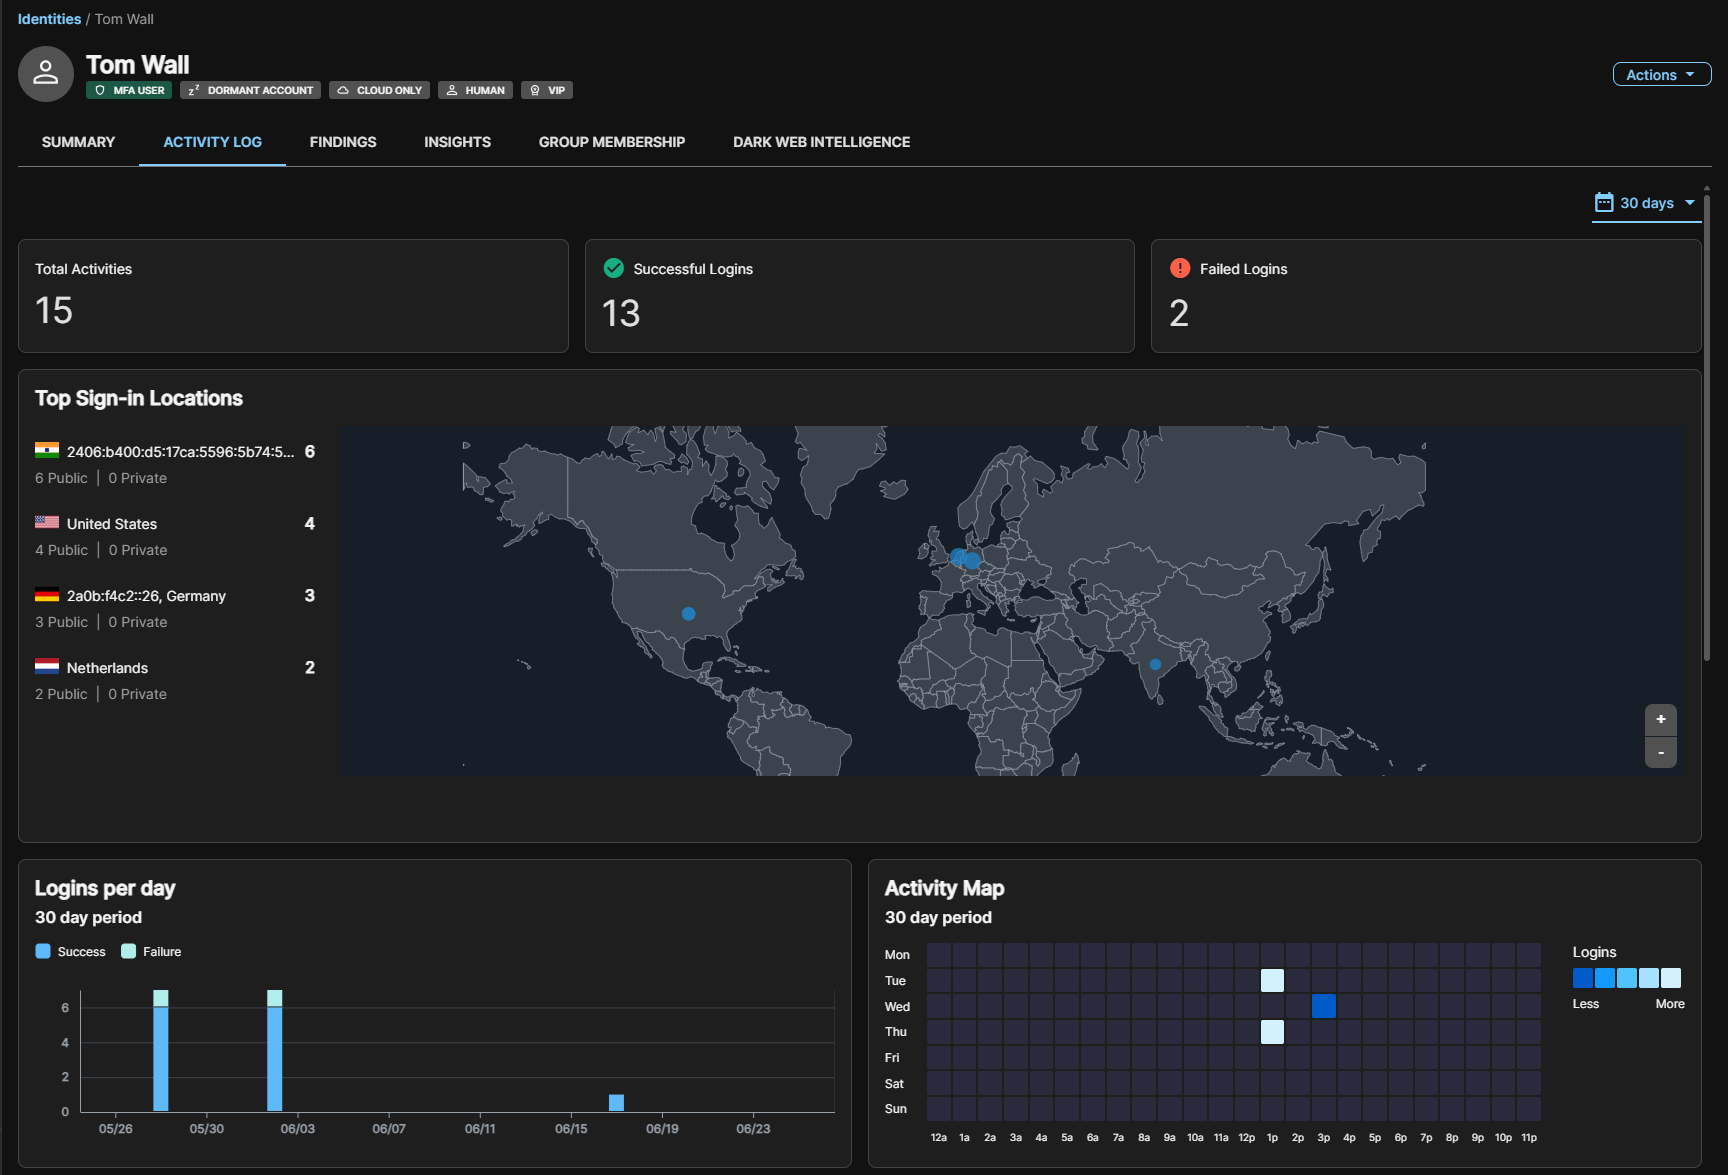
The Activity Log tab shows authentication activity for the identity during the period you set on the top right of the section.
Summary Metrics🔗
At the top of the page, the following metrics give an at-a-glance status of the identity's authentication activity in the selected time period:
- Total Activities: Total number of authentication events.
- Successful Logins: Number of authentication events that completed successfully.
- Failed Logins: Number of authentication attempts that did not succeed.
Top Sign-in Locations🔗
This section lists the countries and IP addresses from which the identity has authenticated, along with a login count per location and a breakdown of public and private IP usage. Locations are plotted on an interactive world map, making geographic anomalies immediately visible.
Logins per Day🔗
This section shows a bar chart of daily authentication volume in the selected time period. Successful and failed logins are rendered in different colors, making it easy to identify spikes or clusters of failed attempts.
Activity Map🔗
This section shows a heatmap of login frequency by day of week and time of day. Color intensity indicates volume, helping you quickly determine whether authentication activity aligns with expected working hours or suggests off-hours access that may warrant further investigation.
Authentication Locations🔗
This section shows the most frequent authentications observed for this entity in the last 30 days, broken down by IP address and ASN. Use the search bar to search for locations, IP addresses, or ASNs.
Findings Tab🔗
The Findings tab displays a table of findings related to the specific identity sorted by risk.
- Hover over the Recommendation field to view the full recommendation.
- Select the finding name to open the finding details.
Insights Tab🔗
The Insights tab displays the following information:
- Open Detections: Open detections for the identity within a default period of the past seven days; use the date picker at the top of this section to change the period.
- Closed Detections: Closed detections within the past 30 days for the identity.
- Cases: Open or closed cases within the past 30 days for the identity.
Group Membership Tab🔗
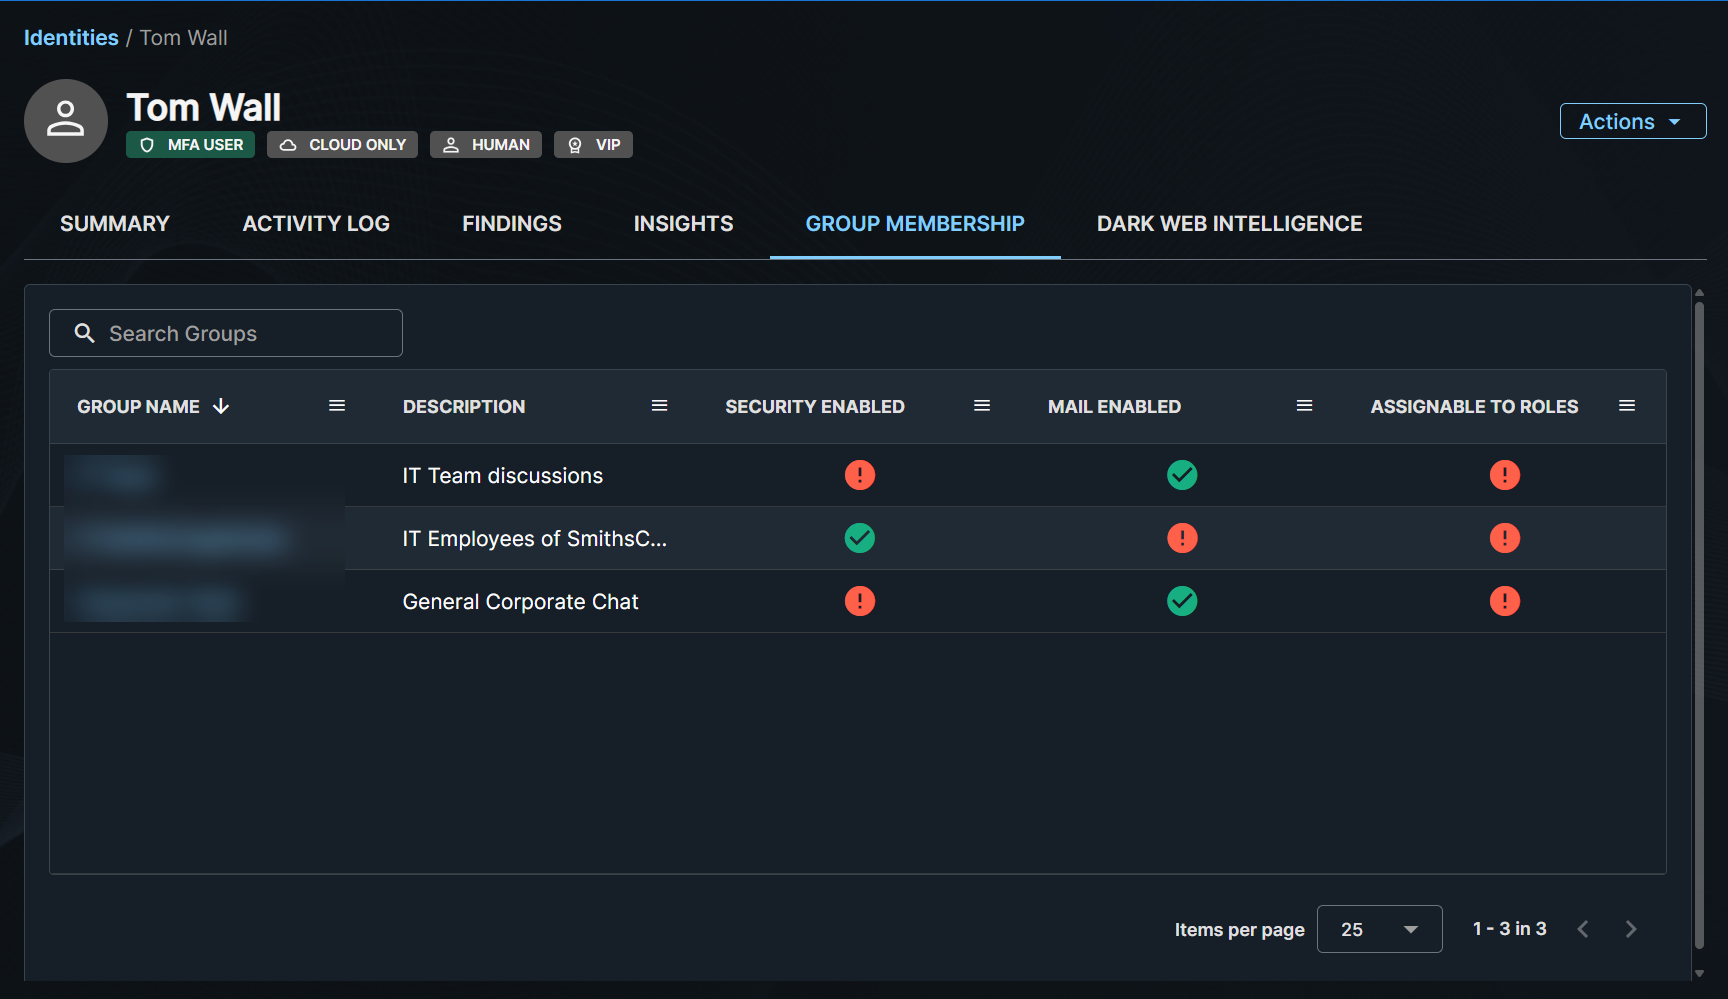
The Group Membership tab displays the list of groups the user is part of. Use the search field to search for groups and select Group Name field to open the group in a new page to view other members.
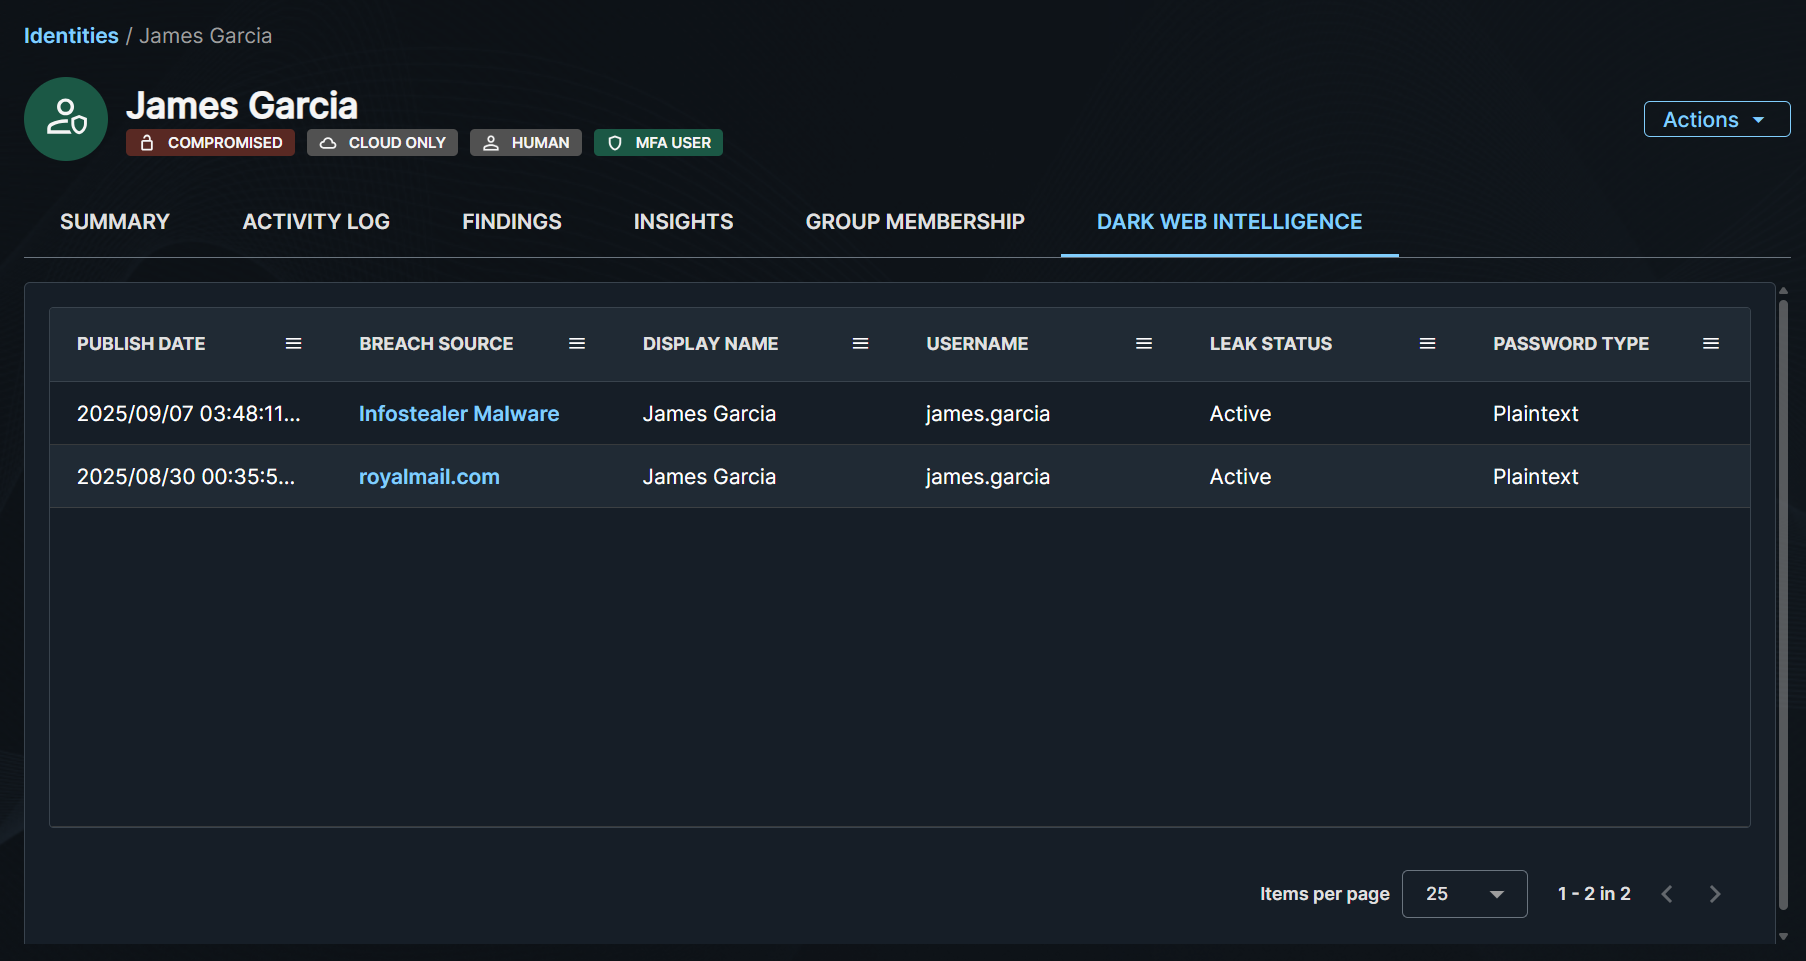
Dark Web Intelligence Tab🔗
The Dark Web Intelligence tab displays a list of breaches to which the identity is linked. Select the link from the Breach Source field to view additional details about the breach record. For more information, see Dark Web Intelligence.