Create Reports from a Template🔗
Templates provide out-of-the-box reports that help you understand your organization’s security posture, the effectiveness of security staff, and the value of Secureworks® Taegis™ XDR. Leveraging Secureworks security operations expertise, these reports have been designed to address common reporting needs and can be utilized without an understanding of the Advanced Search query language.
Tip
Looking to create your own report? See Configure Custom Reports.
To create a PDF report from a template:
- From the Taegis Menu, select Reports.
- Select Create Report.
- Choose one of the predefined report templates and select Next.
Available Report Templates🔗
The following predefined report templates are currently available in XDR.
Agent Trends Report🔗
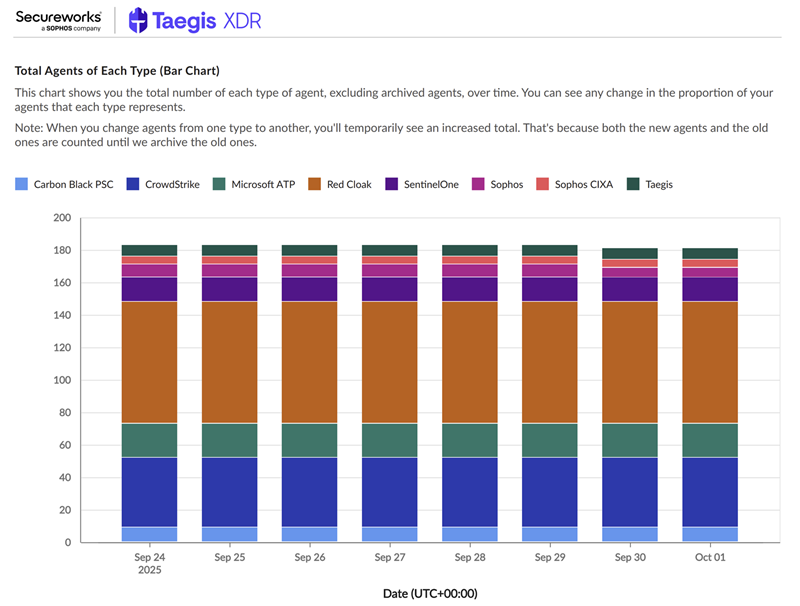
The Agent Trends Report provides an overview of changes to endpoint agent values over time, excluding archived agents. You can choose which agent types and platforms you want to include in the report and specify the report period.
Note
Agent trend data is only available starting April 14, 2025.
The report includes the following summary charts and statistical data, excluding archived agents:
- Total Agents Trend — Shows total number of agents to visualize changes in the total population over time
- Total Agents Types — Shows total number of each agent type in a stacked bar chart to visualize changes in type distribution over time
- Individual Agent Types — Shows total number of each agent type as separate trend lines over time
Case Summary Report🔗
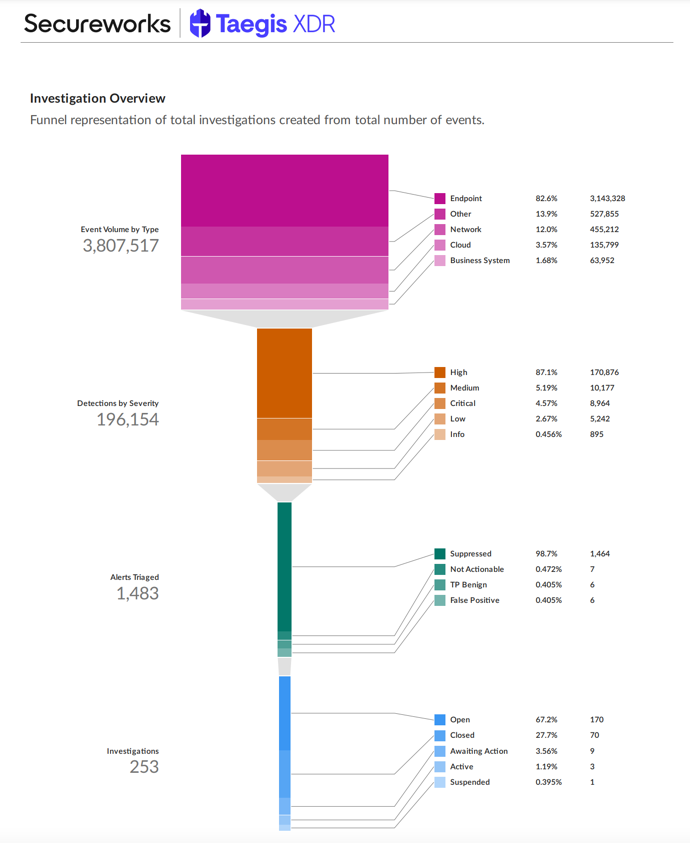
The Case Summary Report provides an overview of case activity occurring in your environment. It includes the following summary charts and statistical data:
-
Case Overview — Depicts the funneling of events filtered through XDR from total events, to detections, to those included in a case
Note
The Event Volume by Type metric included in the Case Overview is calculated once daily at 08:00 AM UTC rather than in real time when the report is run.
-
Case Trends by Status — Displays the trends in volume of cases grouped by all statuses or by status categories, with views for those created by the customer, those created by the service provider, and the aggregate of both
- Case Trends by Type — Displays the trends in volume of cases by case type with views for those created by the customer, those created by the service provider, and the aggregate of both
- Case Creators and Assignees — Displays the top case creators and open case assignees over time
Detection Summary Report🔗
The Detection Summary Report provides an overview of detection activity, volume, and trends in your environment. It includes the following summary charts and statistical data:
- Detection Volume Trend by Severity — Highlights the volume of detections over time by severity, including suppressed detections
- Detection Trends Grouped by Status — Depicts increasing and decreasing trends in critical and high severity detections grouped by detection status
- Top Detection Trends by Volume — A series of charts showing Top 10 detection names, users, host names, source IP, and target IP addresses based on detection volume
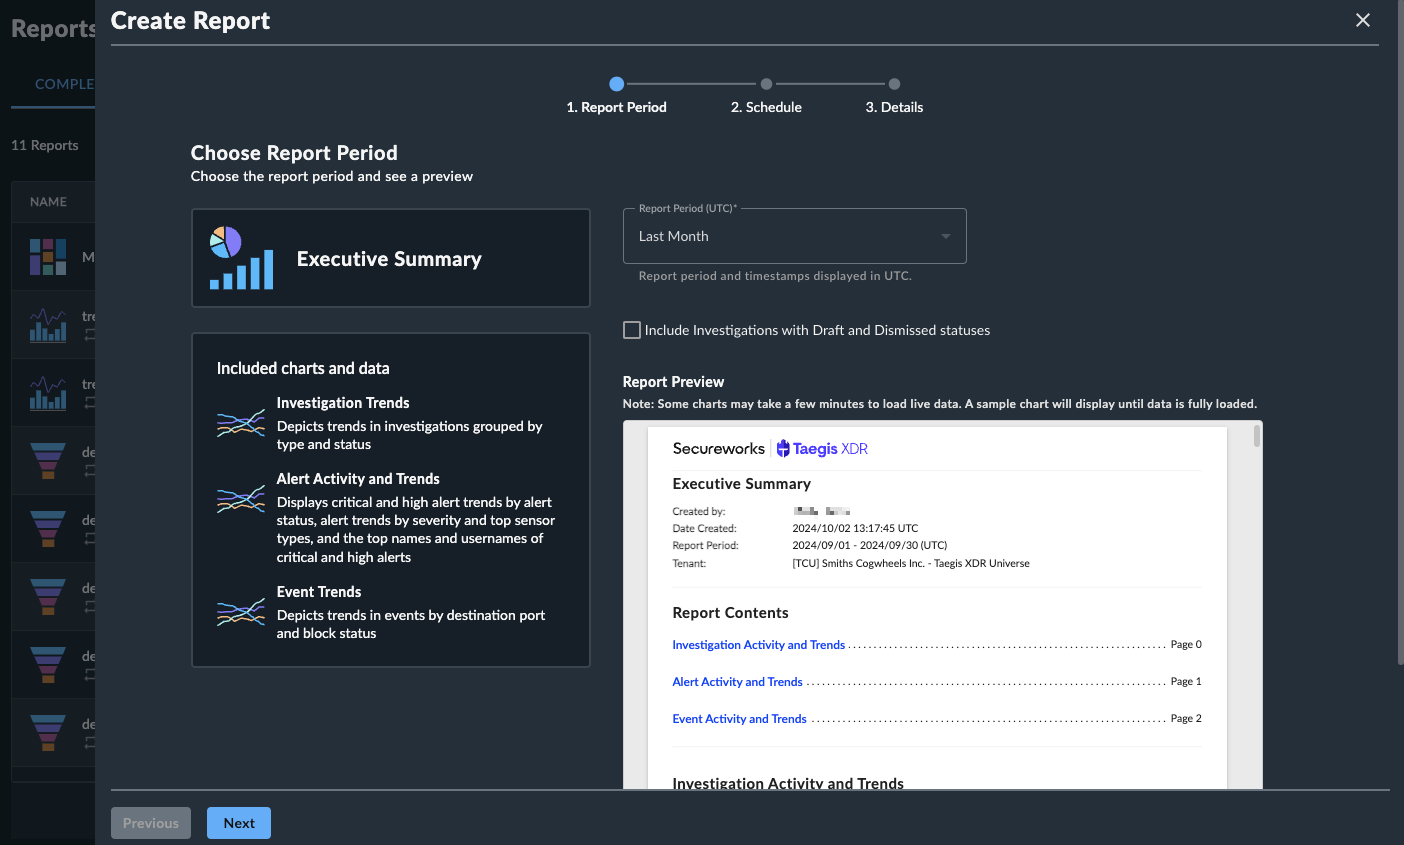
Executive Summary Report🔗
The Executive Summary Report provides a high-level overview of the activity occurring in your environment. It includes the following summary charts and statistical data:
- Case Trends — Depicts trends in cases grouped by type and status
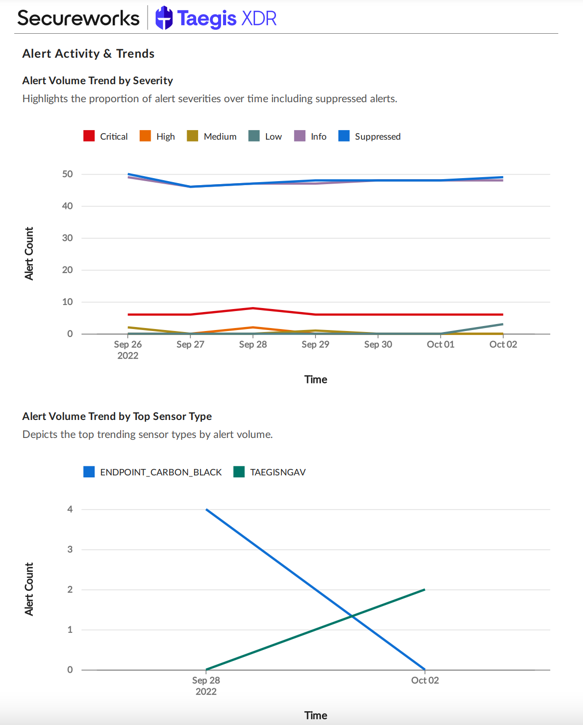
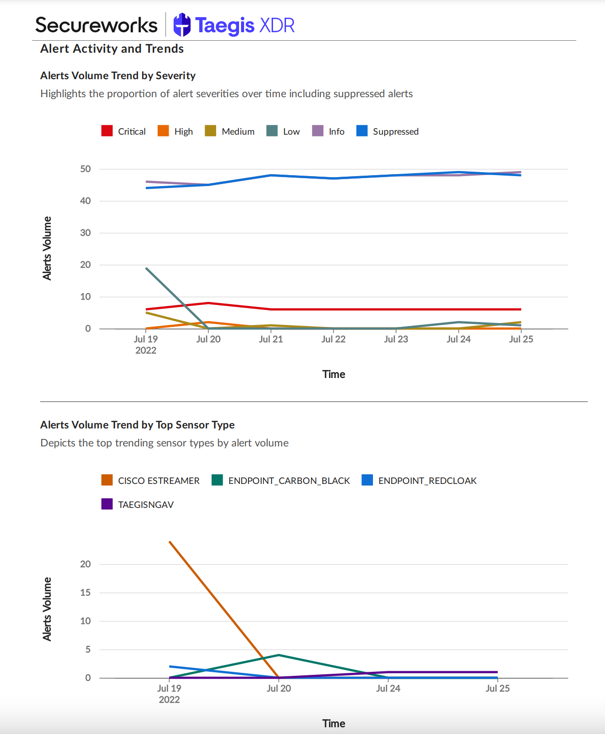
- Detection Activity and Trends — Displays critical and high detections trends by detection status, detection trends by severity and top sensor types, and the top names and usernames of critical and high detections
- Event Trends — Depicts trends in event by destination port and block status
Event Schema Grouping🔗
In the Case Overview funnel chart, event schemas are grouped as follows:
- Network —
dnsquery,generic,netflow,auth,http,nids,dhcp - Endpoint —
dnsquery,generic,netflow,process,auth,persistence,injection.thread,managementevent,registry,filemod,process_module,apicall,script_block - Cloud —
generic,auth,cloudaudit,apicall - Business System —
email,antivirus - Others — any other schemas not in the four groups above
Note
The numbers for each grouping, which are located to the right side of the funnel, may not add up to the total event volume, which is located to the left side of the funnel. This is because events that fall into multiple schema groups get included in the count for each group.
Taegis NDR Change Management Report🔗
Note
Taegis NDR is an evolution of iSensor, but with a new name and soon with expanded capabilities. You may see some references to the iSensor branding as we complete this transition.
For more information on Taegis™ NDR, see Taegis™ NDR Overview.
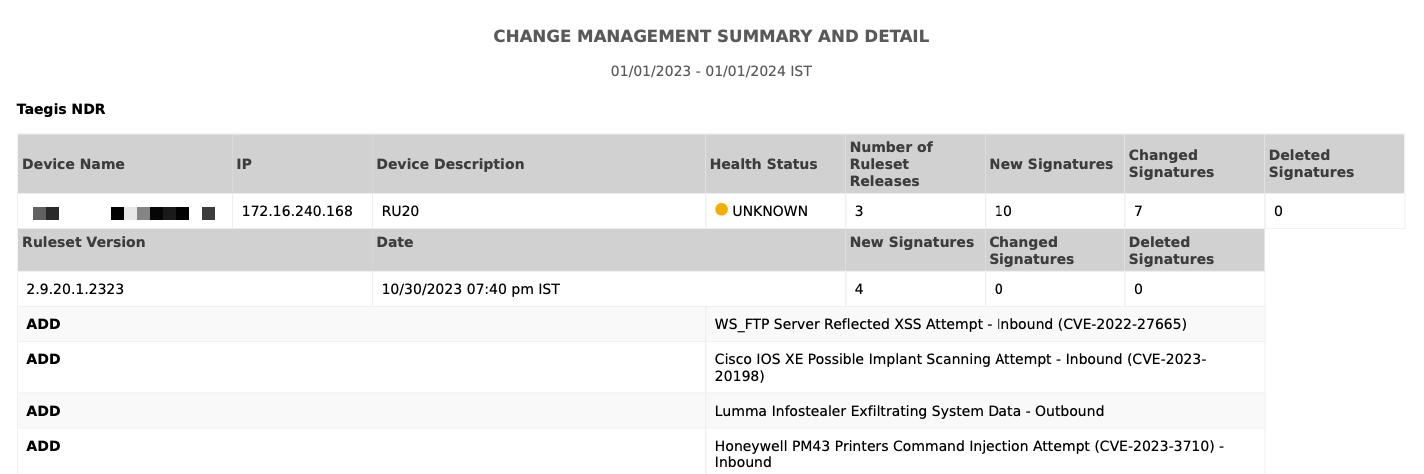
The Taegis™ NDR Change Management Report displays detailed information about signature and ruleset updates made for each NDR Device in your tenant, including the CVEs that map to the rules. It includes the following data:
- Ruleset Version — The version Secureworks assigned to the ruleset
- Timestamp — The date and time this particular ruleset was rolled out
- New Signatures — Total number of new signatures pushed to this NDR Device in this particular ruleset rollout
- Changed Signatures — Total number of changed signatures pushed to this NDR Device in this particular ruleset rollout
- Deleted Signatures — Total number of deleted signatures from this NDR Device for this specific ruleset rollout
- Ruleset Description — Indicates a brief description of the rule
- Rule Status — Indicates whether this rule represents an add, change, or delete
Note
If you run this report but have no NDR Devices in your tenant, the Taegis™ NDR Data Sheet generates instead.
Taegis XDR Trends Report🔗
The XDR Trends Report compares aggregate data on cases, detections, and data usage during the selected report period with data from two previous periods of the same length. It includes the following summary charts and statistical data:
Cases🔗
- Case Overview — A funnel chart that filters through the gigabytes of event data, then detections, then triaged detections, then lastly cases created from those events.
- Case Details by Status — A list of security case details including remediation/last activity, grouped by status.
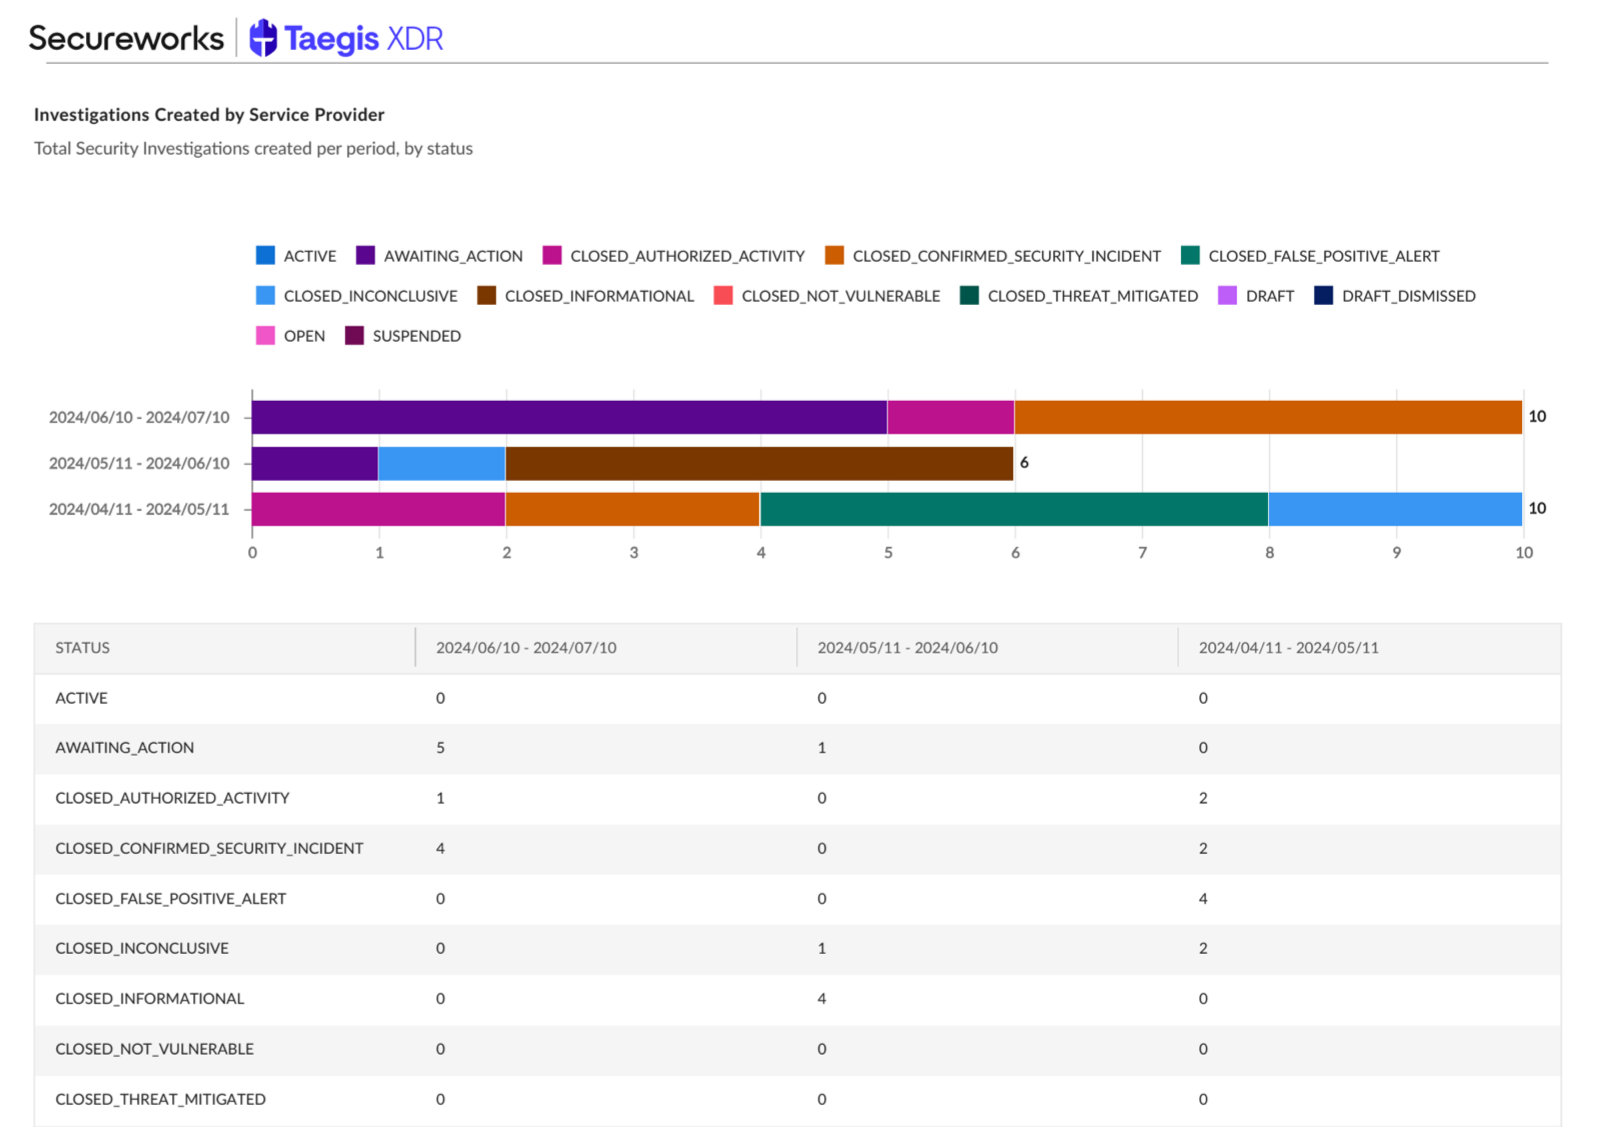
- Cases Created by Service Provider — A stacked bar chart displaying the total number of security cases created by Secureworks or your service provider, broken down by status. It compares the selected report period with two previous periods.
- Cases Created by Tenant — A stacked bar chart displaying the total number of security cases created by members of your organization/tenant, broken down by status. It compares the selected report period with two previous periods.
- Response Time: Mean Time to Hand Off — A bar chart of the mean amount of time elapsed from when a Secureworks analyst took ownership of a case to the initial handoff to your organization. It compares the selected report period with two previous periods.
- Response Time: Mean Time to Acknowledge — A bar chart of the mean amount of time elapsed from when Secureworks initially handed off a case to when someone in your organization initially viewed it. It compares the selected report period with two previous periods.
- Response Time: Mean Time to Resolve — A bar chart of the mean amount of time elapsed from when Secureworks initially handed off a case to the time the case is resolved. It compares the selected report period with two previous periods.
Detections🔗
- Critical and High Detection Volume: Period Comparison — A stacked bar chart of the total number of critical and high detections, broken down by severity. It compares the selected report period with two previous periods.
- Medium and Low Detection Volume: Period Comparison — A stacked bar chart of the total number of medium and low detections, broken down by severity. It compares the selected report period with two previous periods.
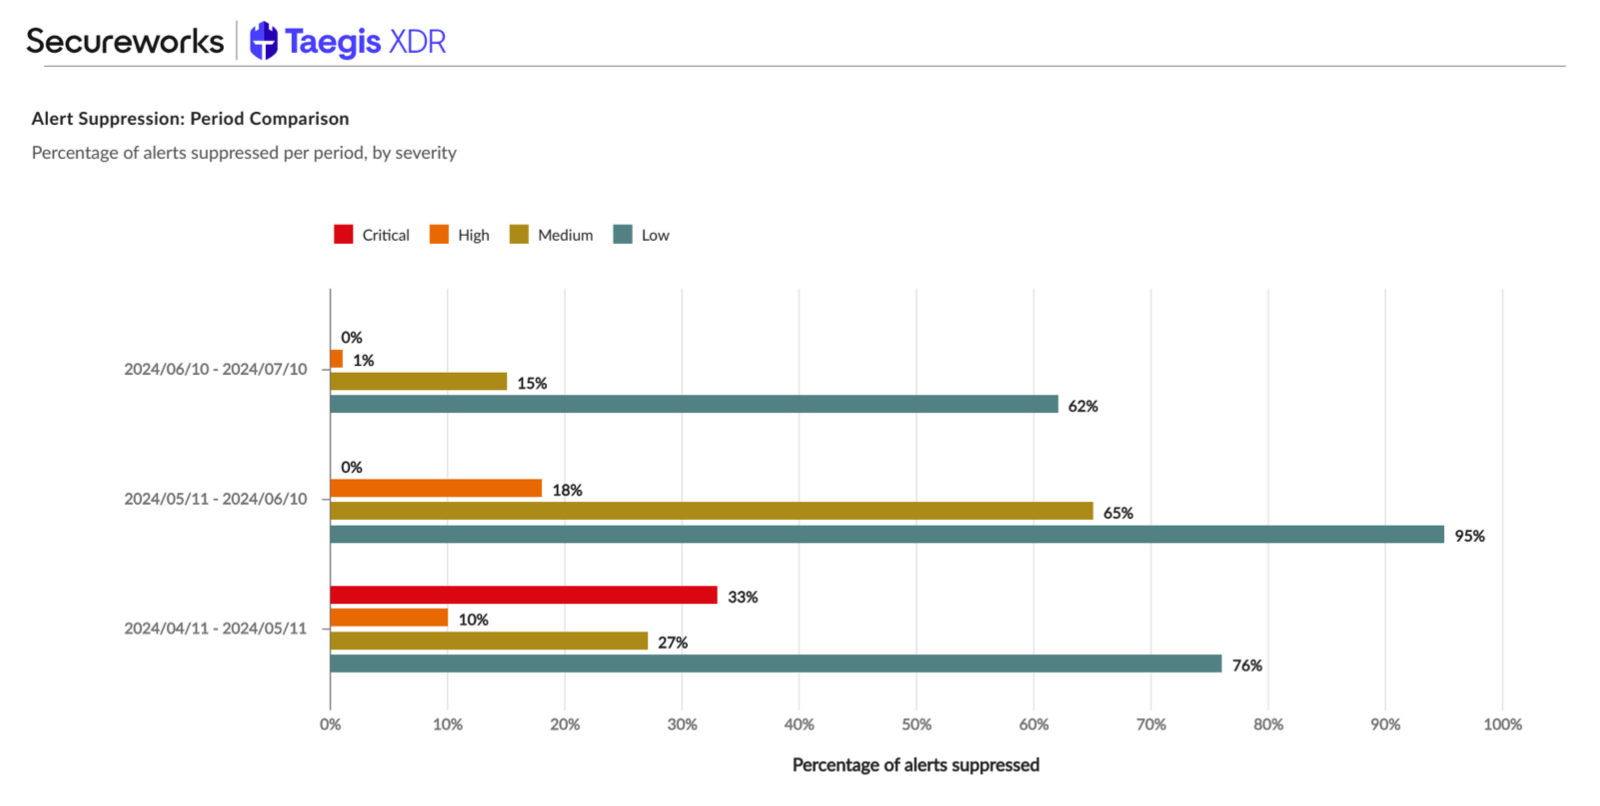
- Detection Suppression: Period Comparison — A bar chart of the percentage of detections that were suppressed, broken down by severity. It compares the selected report period with two previous periods.
- Critical Detection Volume Trend — A line chart comparing the volume of critical-severity detections to the overall trend over time. It compares the selected report period with two previous periods.
- High Detection Volume Trend — A line chart comparing the volume of high-severity detections to the overall trend over time. It compares the selected report period with two previous periods.
- Medium Detection Volume Trend — A line chart comparing the volume of medium-severity detections to the overall trend over time. It compares the selected report period with two previous periods.
- Low Detection Volume Trend — A line chart comparing the volume of low-severity detections to the overall trend over time. It compares the selected report period with two previous periods.
- Top 5 MITRE ATT&CK Techniques: Report Period — A bar chart of the top five MITRE ATT&CK techniques used by threat actors during the selected report period, broken down by number of detections. It compares the selected report period with two previous periods.
- Top 5 MITRE ATT&CK Techniques: Previous Period — A bar chart of the top five MITRE ATT&CK techniques used by threat actors during the previous report period, broken down by number of detections. It compares the previous report period with the report period of the same length before and after.
- Top 5 MITRE ATT&CK Techniques: Pre-previous Period — A bar chart of the top five MITRE ATT&CK techniques used by threat actors during the pre-previous report period, broken down by number of detections. It compares the pre-previous report period with the two following periods.
- Top 10 Users: Period Comparison — A bar chart of the top 10 users related to detections, in order of detection count. It compares the pre-previous report period with the two following periods.
- Top 10 Source IPs: Period Comparison — A bar chart of the top 10 source IPs related to detections, in order of detection count. It compares the pre-previous report period with the two following periods.
- Top 10 Target IPs: Period Comparison — A bar chart of the top 10 target IPs related to detections, in order of detection count. It compares the pre-previous report period with the two following periods.
Data Usage🔗
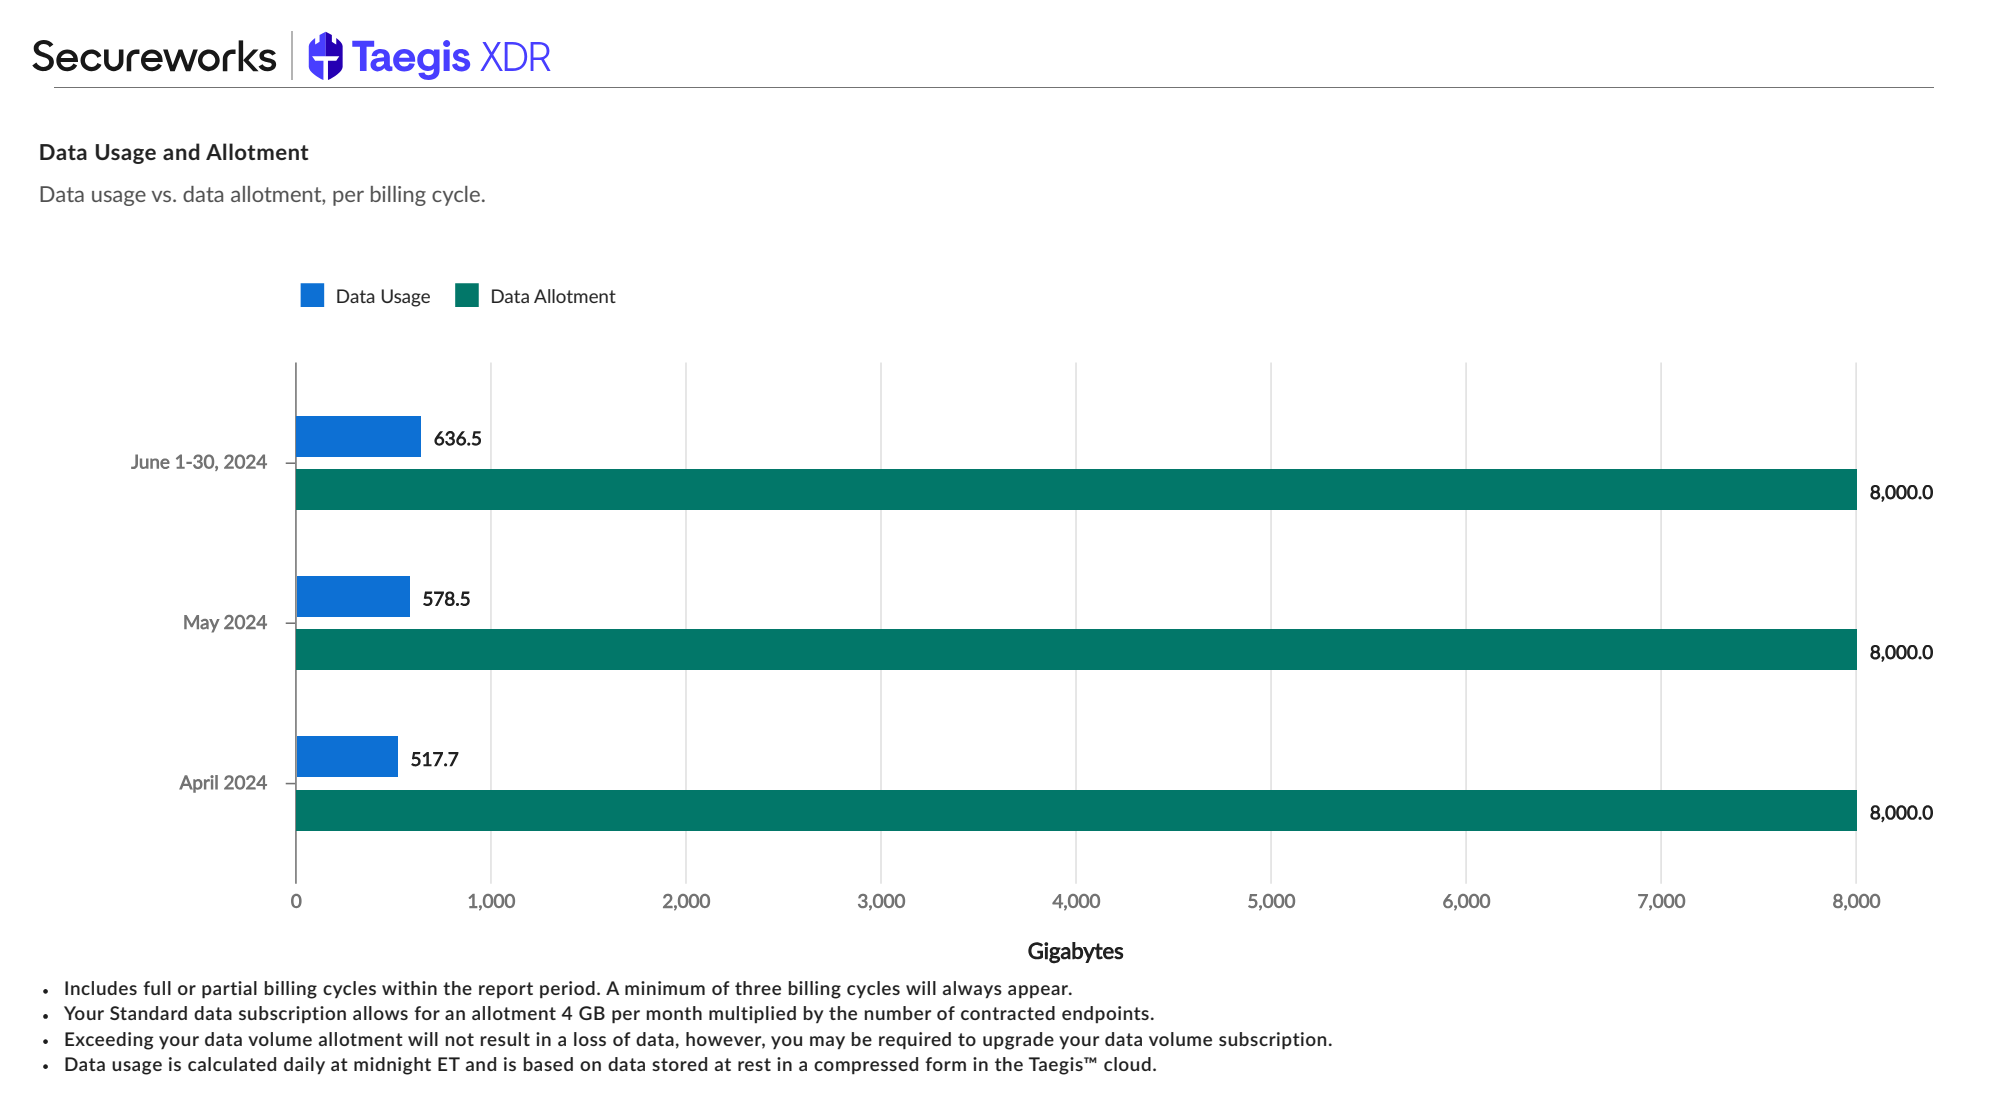
- Data Usage and Allotment by Billing Cycle — A bar chart of the total number of gigabytes used by your organization, versus the total number allotted. It compares the pre-previous report period with the two following periods.
Report Periods Explained🔗
Many charts in the XDR Trends Report compare different time periods. These include:
- Report Period — The time period you selected when creating the report (e.g., the last 30 days)
- Previous Period — The time period of the same length directly preceding the report period (e.g., 60-31 days ago)
- Pre-previous Period — The time period of the same length directly preceding the previous period (e.g., 90-61 days ago)
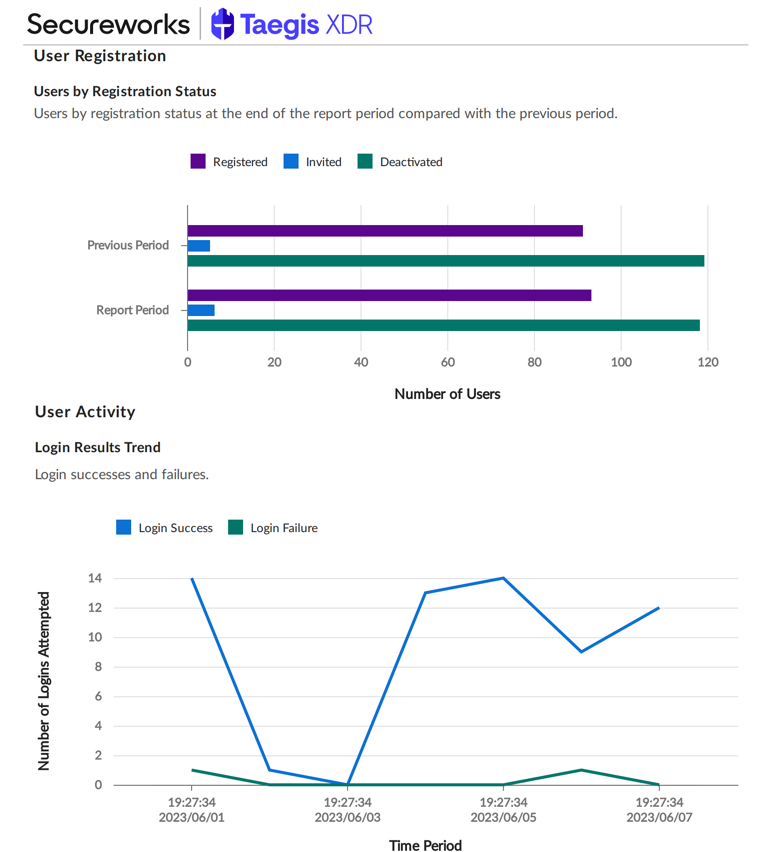
Taegis XDR User Admin Summary Report🔗
The XDR User Admin Summary Report provides an overview of XDR user registration status, roles, activity, and change history in your XDR tenant. It includes the following summary charts and statistical data:
- User Registration — Shows XDR users by registration status and changes to registration status
- User Roles — Shows XDR users by role and changes to user roles
- User Profiles — Shows XDR users whose profile data is incomplete
- User Activity — Shows the most and least active XDR users, as well as XDR login trends and details
Step 1: Configure and Preview the Report🔗
Reports created from templates are predefined, so at this time configuration options are limited to the timeframe of the report data.
As you adjust the configuration options, the report preview image updates automatically.
Note
Reports with detections do not support data aggregation of more than 7 days if viewing All Tenants. Select an individual tenant, or reduce the timeframe.
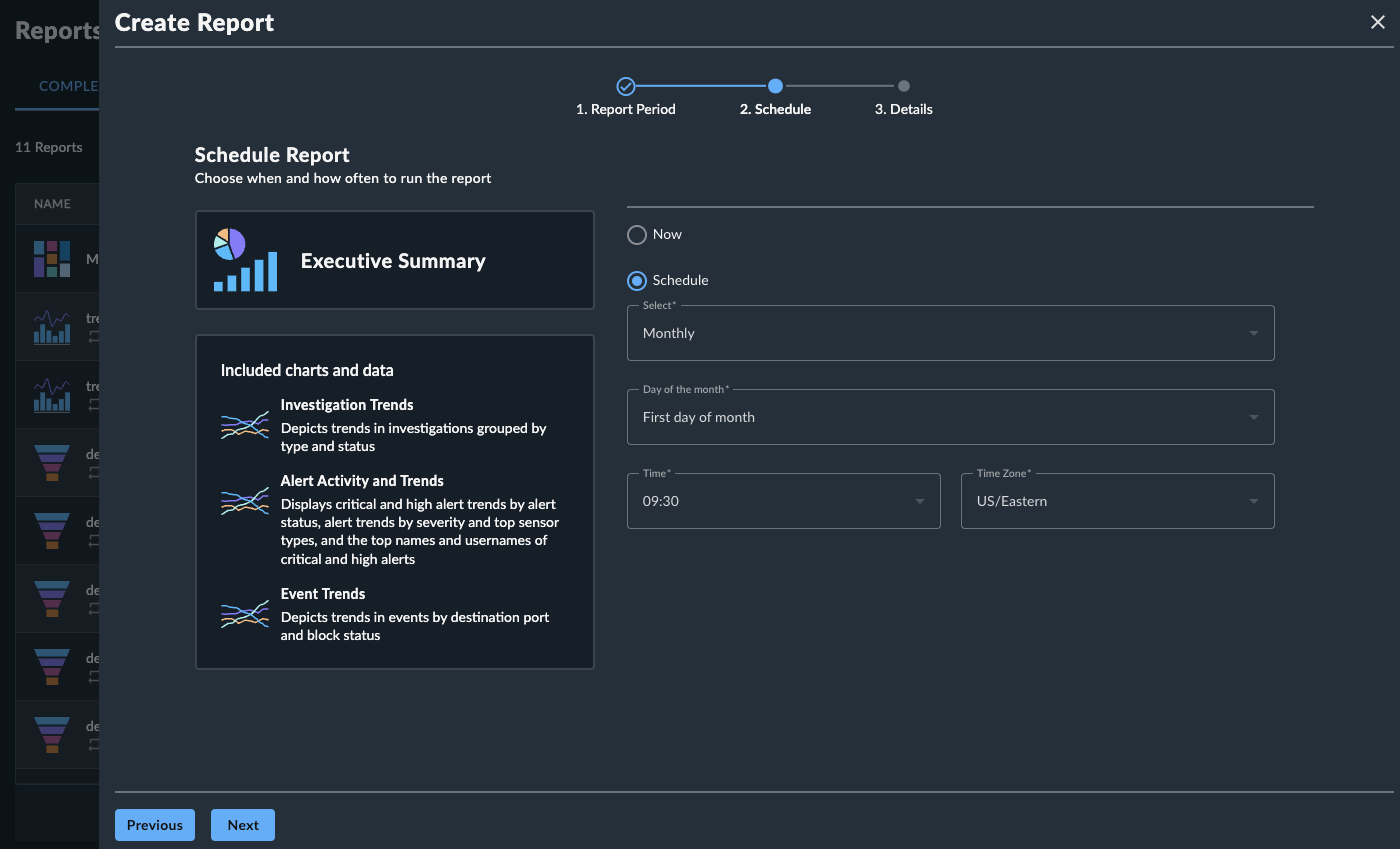
Step 2: Schedule Report🔗
A report can be scheduled to run at a variety of intervals as defined below. One scheduling option may be defined per report.
- Now — The report is executed immediately upon completion of the configuration process.
- Once — The report is executed once at a date and time specified by the user.
- Daily — The report is executed once every day of the week at a designated time.
- Weekly — The report is executed once per week on a specified day and time.
- Monthly — The report is executed once per month on a specified numeric day of the month and time. If the defined day is greater than the last day of the month, the report will be executed on the last day of the month.
- Annually — The report is executed once per year on a specified date and time.
Note
The time zone field specifies what time zone a scheduled report should run; it does not affect the timestamps used throughout the report data.
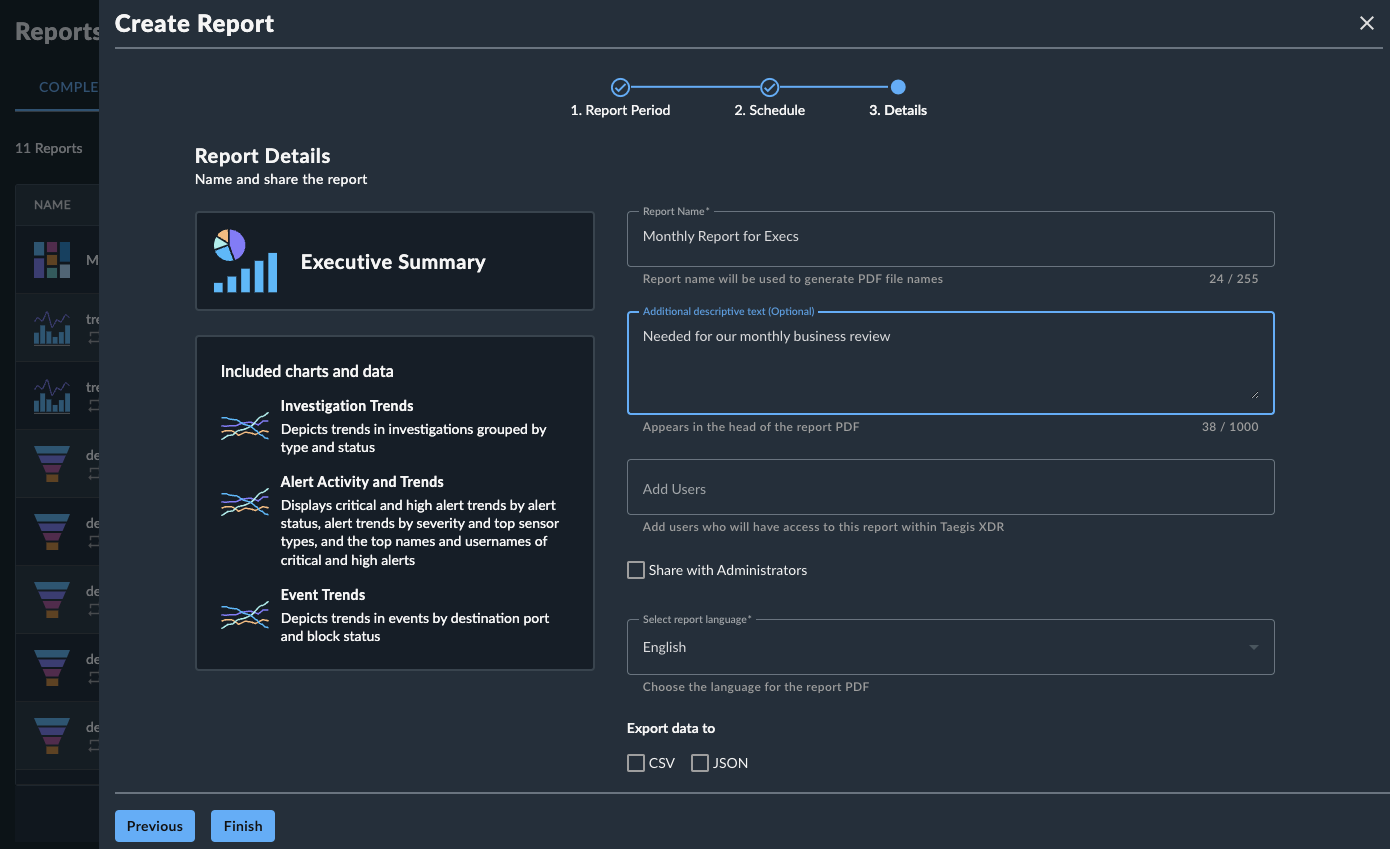
Step 3: Report Name and Sharing🔗
In the last step of report configuration, define the following:
- Report Name — A name for the report, which is used as the file name, the header inside the file, and a quick reference in the Scheduled and Completed Reports tables. (255 character limit; supported characters:
/ - _ ( ) % & # ! , . ' " @ $ ^ * ~) - Description — (Optional) Descriptive text that provides context of the contents of the report for recipients’ benefit. This is embedded in the header of the report file. (1,000 character limit)
- Users — Any XDR users within the current tenant that will receive the report. Each named user, including the report creator, will receive email notifications when the report is completed, with a link to download the report. Users you share the report with can unsubscribe if they do not wish to receive the report.
- Share with Administrators — Check this option to add the report to the Completed Reports table for Tenant Administrator users when it runs. They will not receive notifications for the report.
- Language Selection — Select English or Japanese for the report language.
Note
You automatically receive any report that you create yourself; you do not need to add yourself to the user list.
Available Output File Formats🔗
Reports are generated as PDF files by default. To generate a CSV and/or JSON file that contains the non-aggregated data with the PDF for supported reports, select the Export data to CSV and/or JSON option.
Step 4: Complete the Report🔗
After all configuration steps are completed, select Finish. The query results page is displayed, with a banner informing you that the report is being created. You will receive an email notification when it is ready to download.