Custom Detection Rules🔗
Custom detection rules may be used to create detections from normalized events in Secureworks® Taegis™ XDR.
Tip
The Secureworks Professional Services team is here to help you realize the full potential from your Taegis XDR investment if a higher level of support is desired. Our highly skilled consultants can help you deploy faster, optimize quicker, and accelerate your time to value. For more information, see Professional Services Overview.
Custom Detection Rules Manager🔗
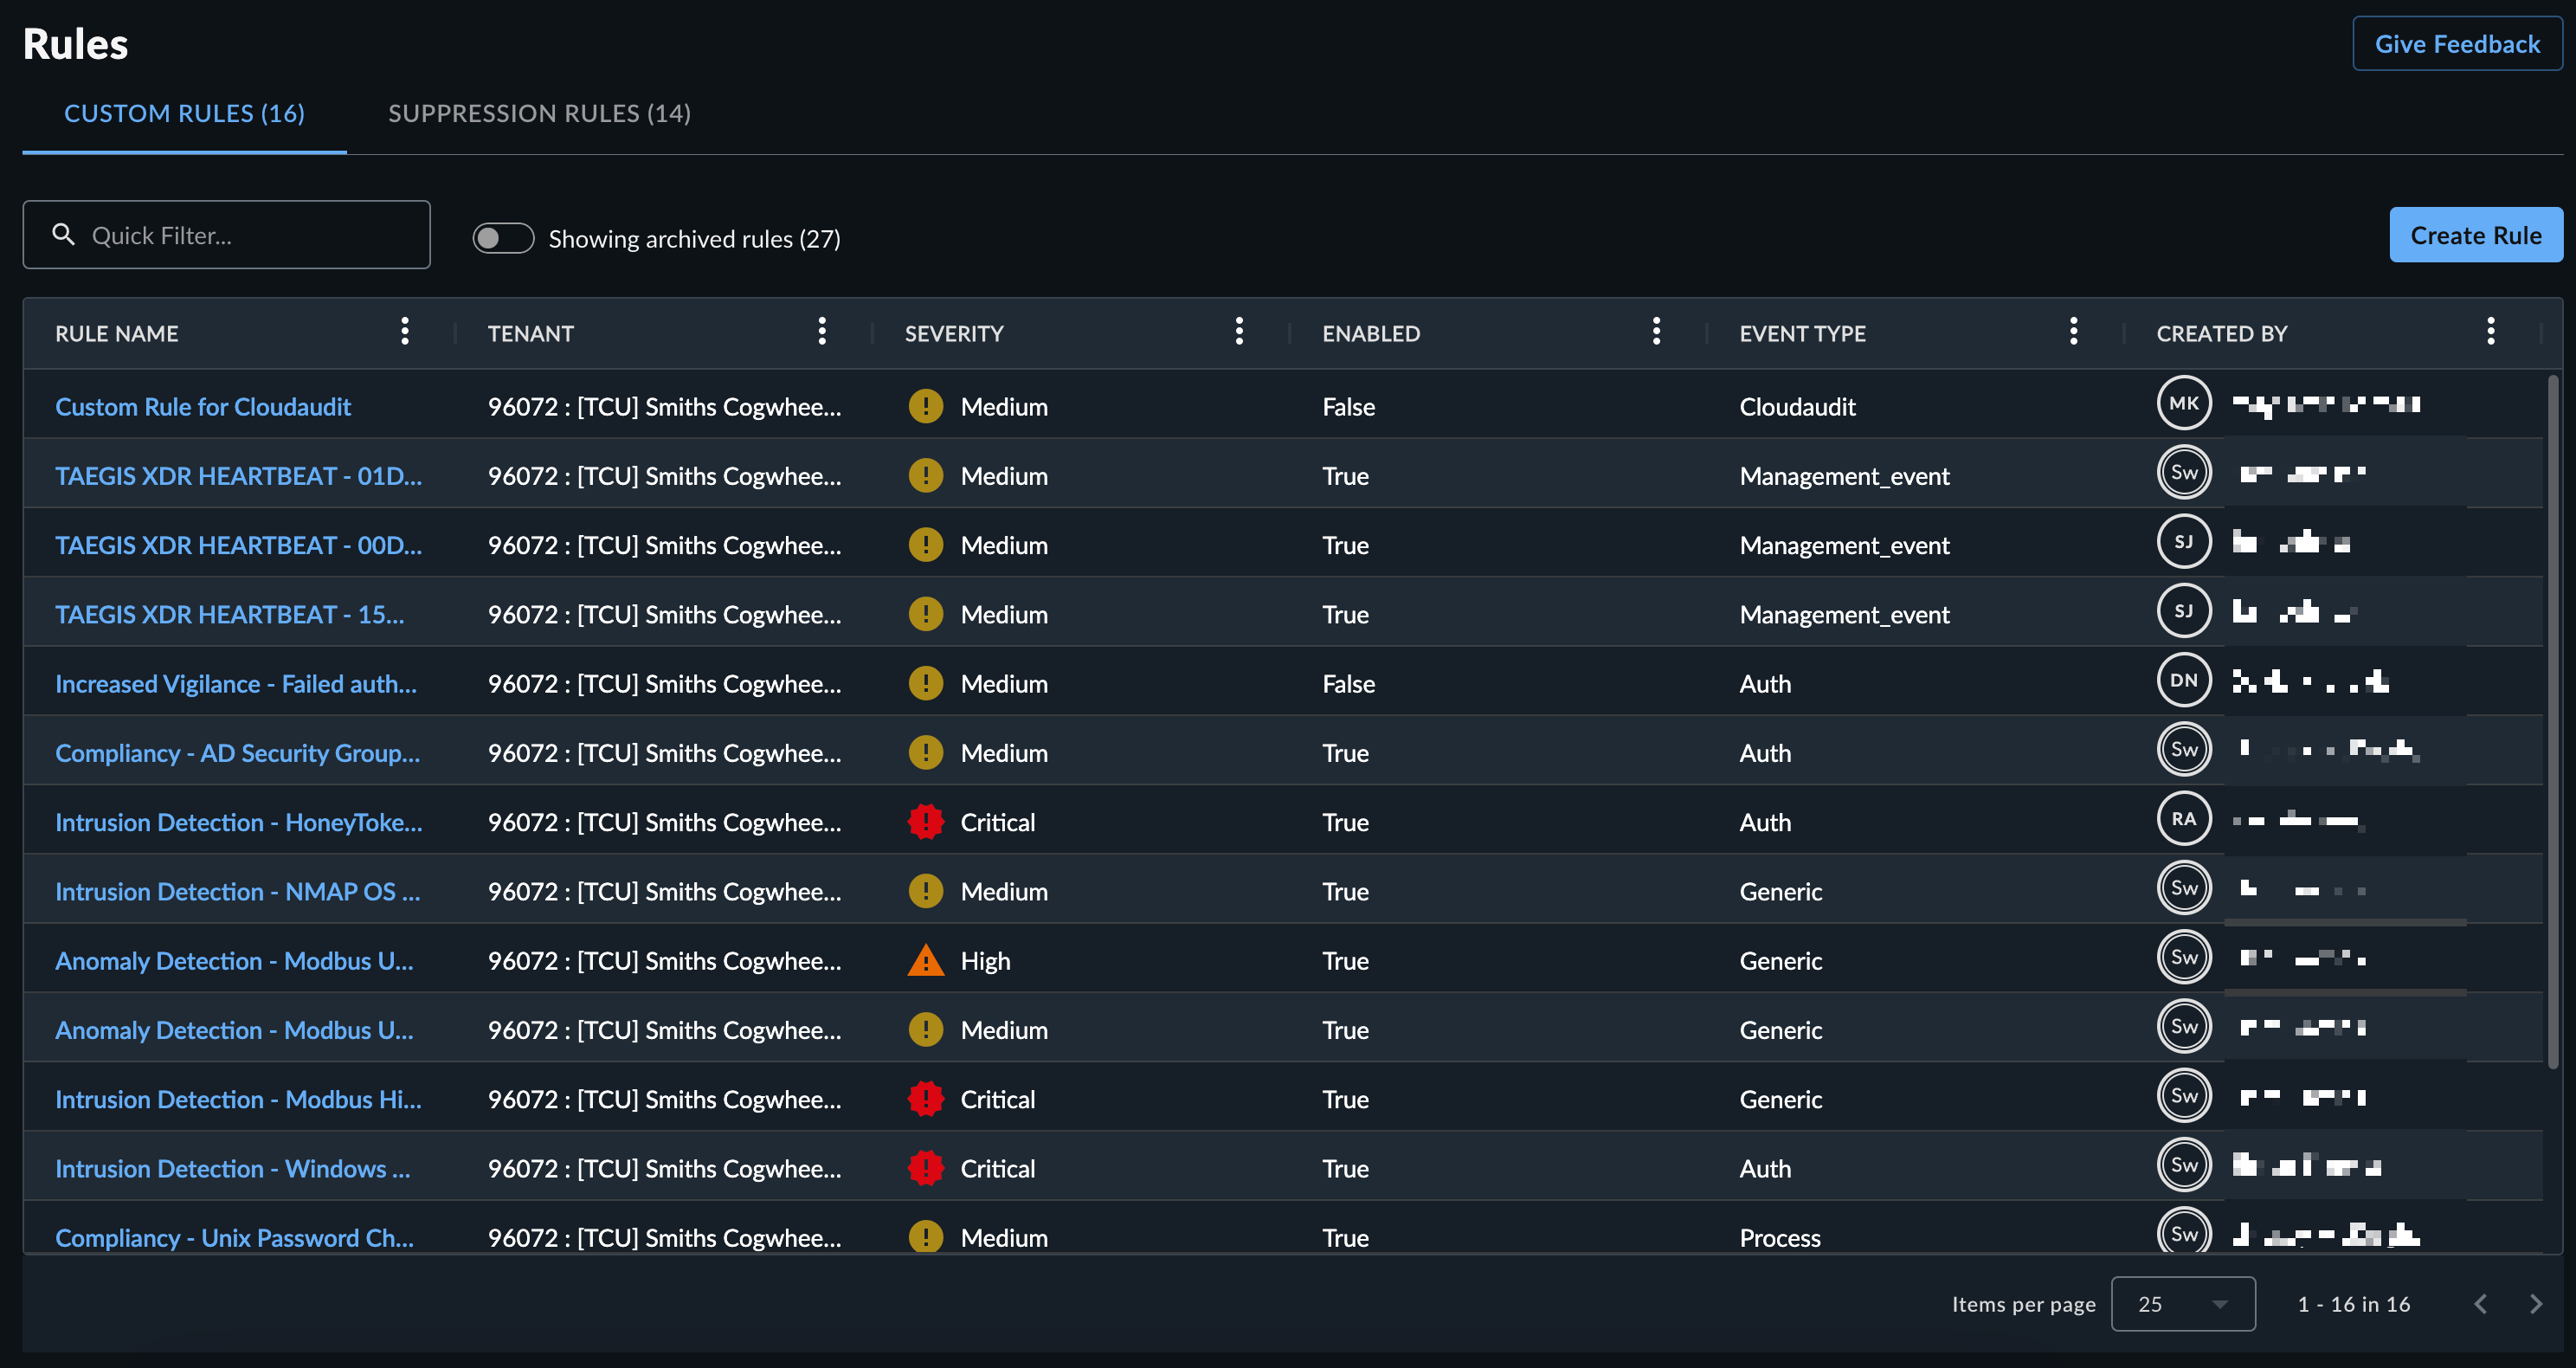
From the Taegis Menu, select Detections → Customization Rules. The Custom Rules table displays all the current custom rules.
Create a Custom Rule🔗
Tip
Use Data Lake Search first to create the rule syntax that targets the desired events for the Rule Criteria field.
Custom Rules uses a different regex engine than Data Lake Search. Some patterns are not supported in Custom Rules, including backreferences and conditional patterns.
- From the right corner above the Custom Rules table, select the Create Rule button. The Create Custom Rule Panel displays.
-
Enter an Advanced Search query language query into the Rule Criteria field.
-
Regular expressions are supported within the limitations of the high performance regex engine. See the FAQ "What are the regex limitations of Custom Rules?" for more information.
-
IPv4 CIDR notation is supported on IP fields with operators
=andmatches. -
Glob patterns are not supported.
-
Custom Rules run queries against streaming data and Primitive Fields do not automatically get default values, which differs from data stored in the Taegis data lake and queried by Data Lake Search. In Custom Rules, you can use the NULL operators to check if these Primitive Fields are set.
Note
The following characters have special meaning within regular expressions:
. ^ $ * + - ? ( ) [ ] { } \ | /. For IP addresses, domain names, and other instances, take care to escape the characters with a backslash:1\.1\.1\.1.
To escape long sequences that contain multiple characters, enclose the whole string between\Qand\Eso that the string is not evaluated for regex characters. For example, escaping this full string:
\Q${jndi:ldap://log4shell-smb-21yg3cbuy21gbcy21gc321uc${lower:ten}.w.nessus.org/nessus}\E
is equivalent to:
\$\{jndi:ldap:\/\/log4shell\-smb\-21yg3cbuy21gbcy21gc321uc\$\{lower:ten\}\.w\.nessus\.org\/nessus\} -
-
Add a Name, Mitre Attack Categories, and Description to the rule. These are used for the generated detection.
- Select the desired severity for generated detections.
- Select Create Rule.
How to View Custom Detections🔗
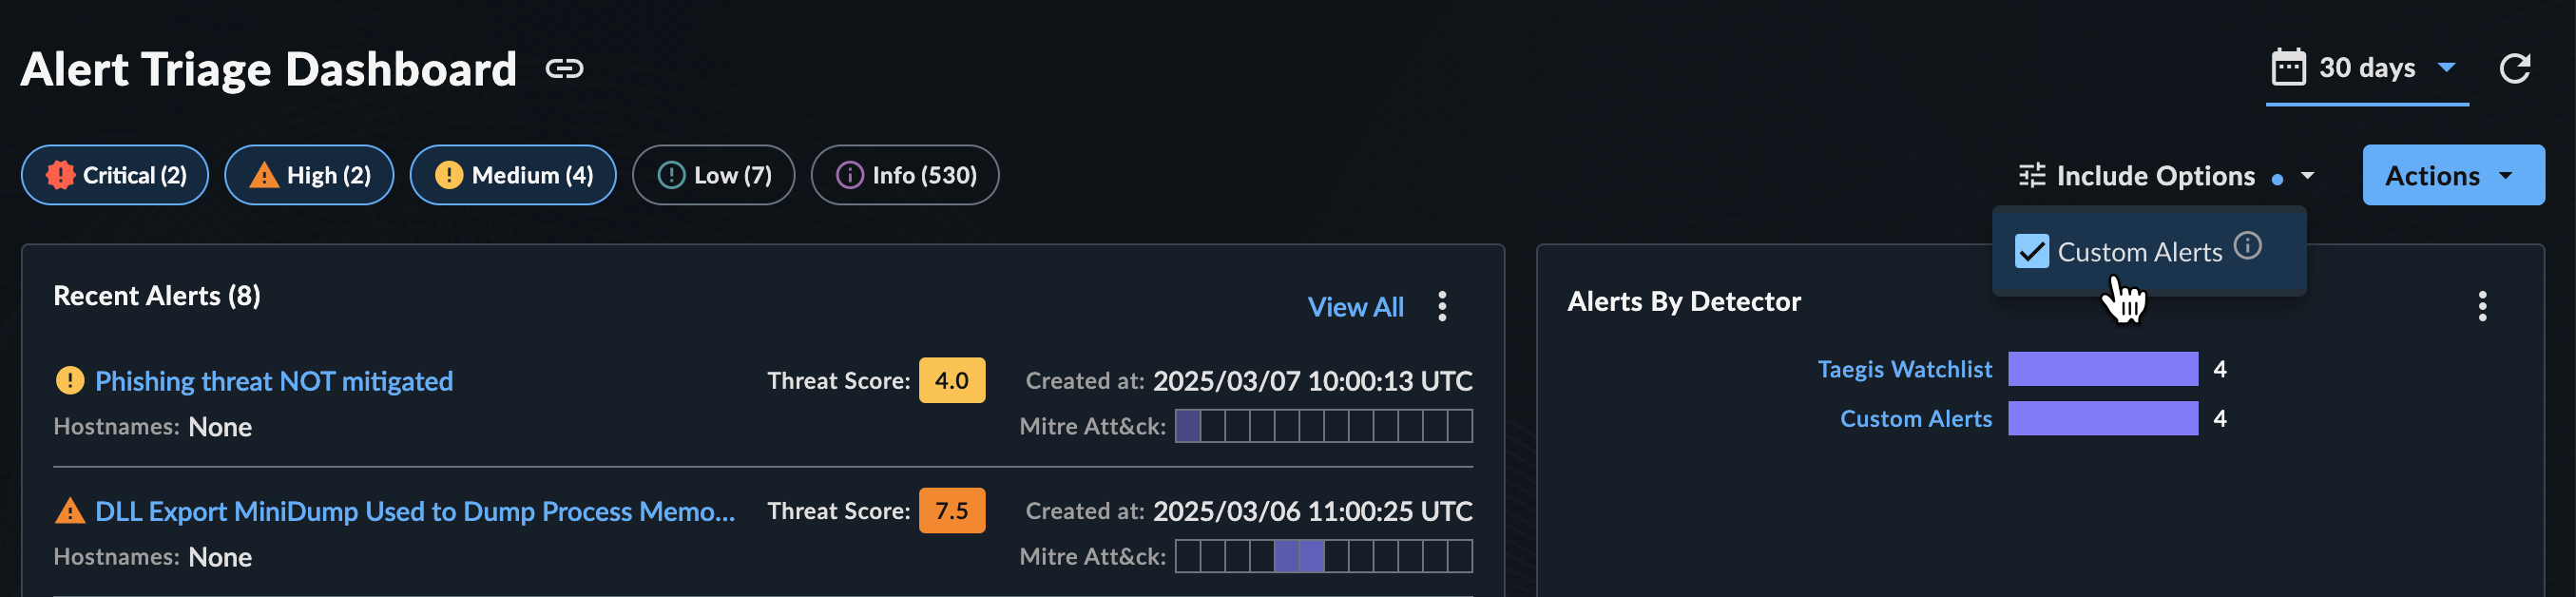
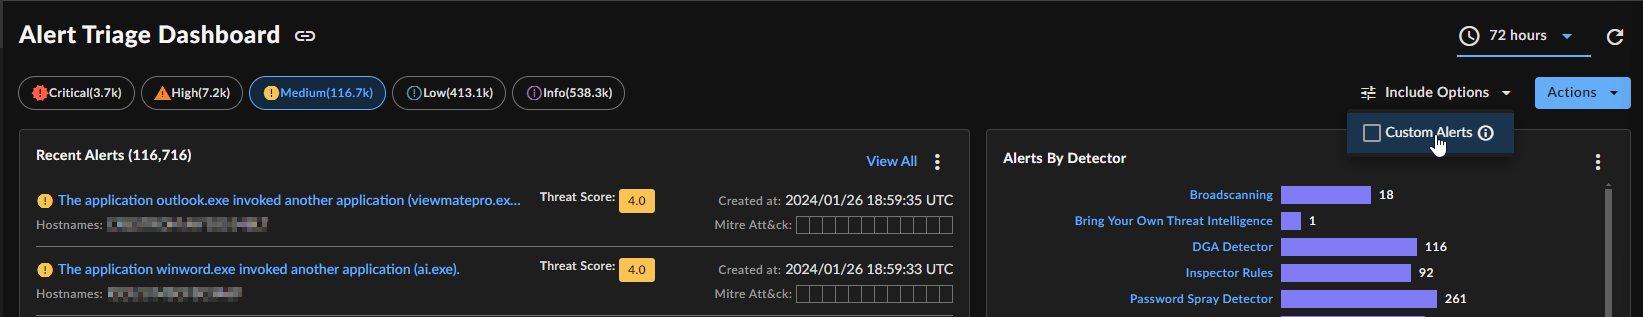
Detections generated by custom rules are displayed in the XDR Detection Triage Dashboard Detections by Detector widget under the detector name Custom Detections.
Tip
Not seeing matching detections? Make sure you have the correct severity level selected at the top of the Detection Triage Dashboard.
Remove Custom Detections from Detection Triage Dashboard🔗
You can remove custom detections from the Detection Triage Dashboard view by selecting Include Options above the Detection Triage Dashboard and toggling the Custom Detections option.
View Custom Rule Details and History🔗
Select a rule name from the Custom Rules table to view its details and history.
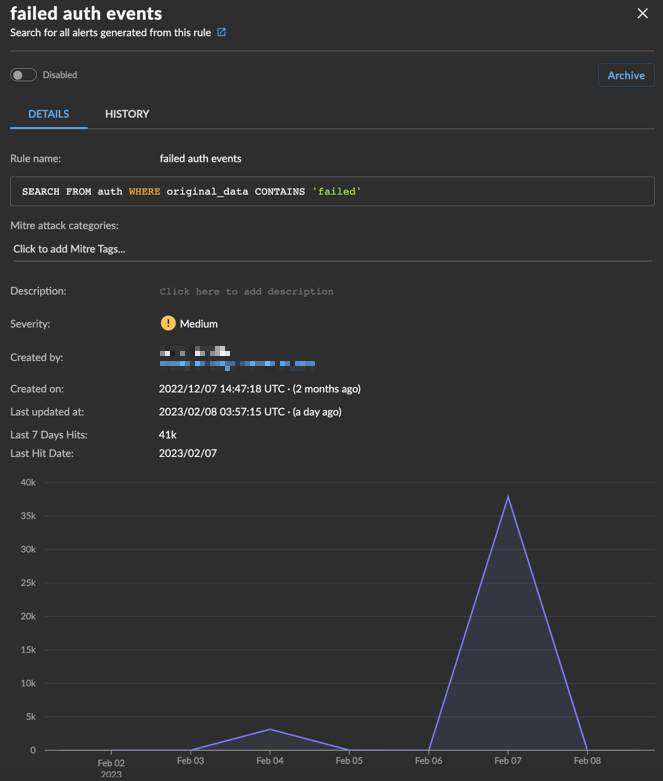
The Detail tab of the custom rule contains overview information for the rule with the criteria the rule matches on. If the rule has matched on and created detections in the last seven days, the following display:
- Number of hits in the last seven days
- Last hit date
- Line graph visualizing the amount of hits
If there has been no activity in the last seven days, this section does not display.
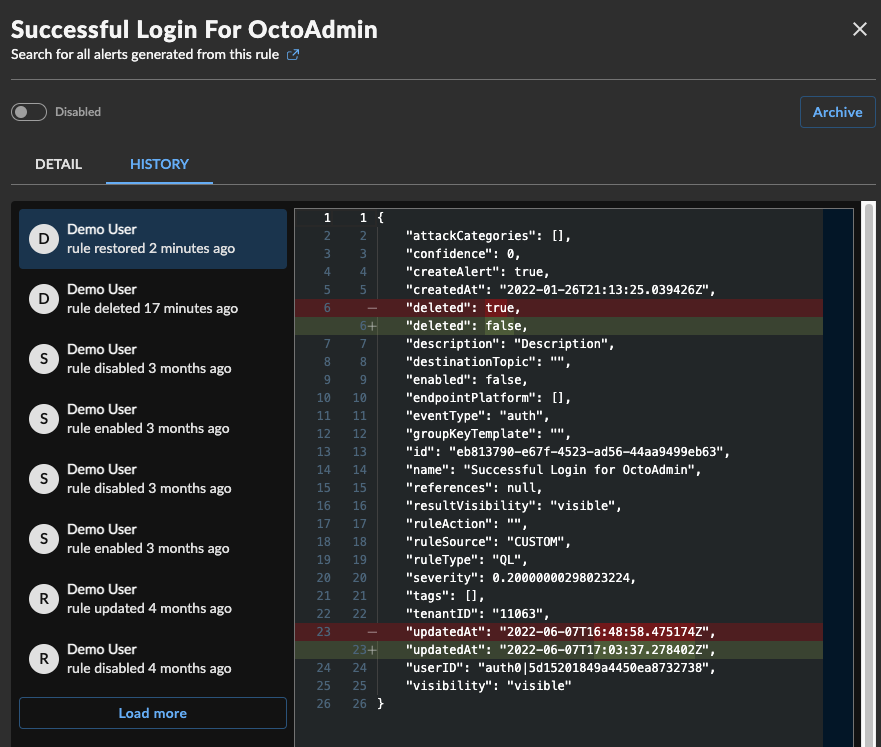
The History tab of the custom rule contains a changelog of edits to the rule. Choose an audit log from the list on the left to view the diff in the right pane.
Archive and Restore a Custom Rule🔗
When viewing a custom rule, you can archive the rule by selecting Archive and confirming the action. This disables the detection, marks it as archived, and removes it from the default view of the Custom Rules table.
To view archived rules, select the Showing Archived Rules toggle above the Custom Rules table.
When viewing an archived custom rule, you can restore the rule by selecting Restore and confirming the action. This restores the rule in a disabled state and returns it to the default view of the Custom Rules table. Select the toggle to enable the rule.
FAQ🔗
How are custom rules supported in Taegis MDR?
You can create custom rules, using the Custom Rules feature within XDR, which alert you when specific criteria that you set are then detected. This feature gives your security team the flexibility to create rules specific to your environment and allow further customization of your internal capabilities. As these can vary greatly from customer to customer, our analysts are unable to monitor your custom rules. Therefore, if you implement custom rules, then you must have internal resources and processes to manage the corresponding detections.
Can I use logical data types, such as domain, IP address, etc., in detection rules?
Yes, use logical data types to help match against data types represented across multiple fields in the schema. The only caveat is that rules can only match against a single schema type, but the logical data type will expand to the fields available within the individual schema.
Example Rule Criteria: FROM auth WHERE @user='gcostanza' AND win_event_id='4624'
How do I audit rule changes?
Actions in the rules manager are viewable under Tenant Settings → Audit Logs. Audit logs will have the category of Rules.
Additionally, a changelog of edits to the rule is available from the rule itself. See View Custom Rule Details and History.
Who can create rules?
At this time, any role can create detection rules. This will change with forthcoming Role-Based Access Control.
Are all schema fields available for custom detections?
Most event fields are available, except for the following fields which are added to the event after it is processed by the detection engine.
For schemas auth, netflow, and dns_query, the following objects and fields are not available for custom detection rules to match:
dest_ipgeo_summarysrc_ipgeo_summarysrc_ipblacklist_hitsdest_ipblacklist_hits
For all schemas, the following field is not available for custom detection rules to match:
- hostname
For schema dns_query, the following object is not available for custom detection rules to match:
whois
Are custom rules limited in how many detections they can create?
Yes; custom rules that exceed 5,000 detections an hour or 100,000 in 24 hours will be disabled by the circuit breaker. Please, either update the rule to decrease the number of detections, or pivot the rule to a Custom Report.
Note
The circuit breaker will email the rule author informing them if the rule has been disabled due to exceeding the limits.
What are the regex limitations of Custom Rules?
The following regex constructs cannot be supported by Custom Rules:
- Backreferences and capturing sub-expressions
- Arbitrary zero-width assertions
- Subroutine references and recursive patterns
- Conditional patterns
- Backtracking control verbs
- The \C “single-byte” directive (which breaks UTF-8 sequences)
- The \R newline match
- The \K start of match reset directive
- Callouts and embedded code
- Atomic grouping and possessive quantifiers
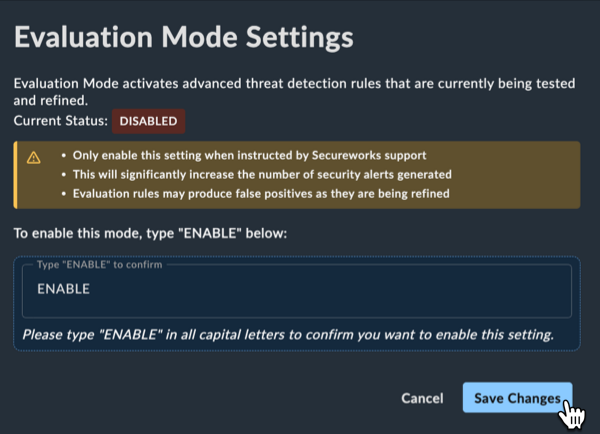
Evaluation Mode Settings🔗
Evaluation Mode activates advanced threat detection rules that are currently being tested and refined. Enabling this setting does not alter data ingestion in any way, but does allow for additional advanced detections to be created. Be aware of the following important points before enabling this setting:
Important
- Only enable this setting when instructed by support.
- Enabling this setting will significantly increase the number of security detections generated.
- Evaluation mode rules may produce false positives as they are being refined.
Enable Evaluation Mode🔗
Tenant Admins can enable Evaluation Mode by following these steps:
- Select Detections from the Taegis Menu and choose Rules.
- From the upper right corner of the Rules page, select Settings.
- Type "ENABLE" in all capital letters in the text field to confirm you want to enable this setting.
- Select Save Changes.
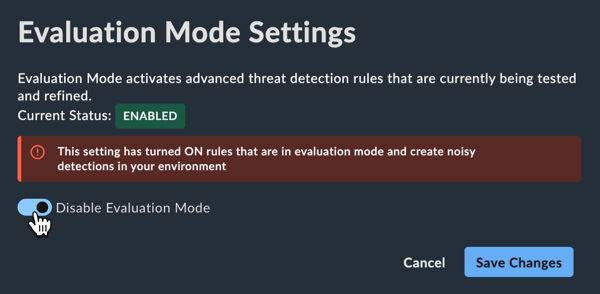
Disable Evaluation Mode🔗
Tenant Admins can disable Evaluation Mode by following these steps:
- Select Detections from the Taegis Menu and choose Rules.
- From the upper right corner of the Rules page, select Settings.
- Select the Disable Evaluation Mode toggle.