Threat Score🔗
Note
The terms Alerts and Investigations have recently been changed to Detections and Cases in Taegis XDR. You may still see references to the old terms while we continue to work towards platform convergence of Sophos and Taegis technologies. For more information, see Taegis Terminology Updates.
Organizations continue to battle an endless stream of detections from the growing inventory of security products. As a result, security analysts are increasingly experiencing detection fatigue, a phenomenon whereby they become desensitized to detections due to the number of false positives they investigate. A lack of context is one of the leading causes of the high false positive rates plaguing the industry. Ultimately, detection fatigue leads to an increase in response time to real threats and reduced vigilance on the part of the security analyst.
The Secureworks® Taegis™ Threat Score is a contextually aware priority value assigned to detections by the patent-pending Taegis Prioritization Engine. The Prioritization Engine improves security analyst triage workflows by automating repetitive tasks and reducing false positives using context observed within your tenant and the Taegis global customer base. The score ranges from 0 - 10 with a higher score representing a higher risk to your organization.
Important
The Threat Score is available on detections created after October 18, 2023. Detections created prior to this date do not have an associated Threat Score.
How It Works🔗
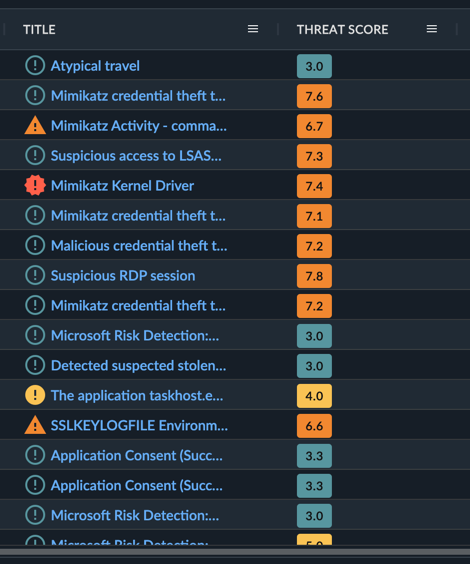
Each Critical and High severity detection is assessed and assigned a Threat Score at the time it is created. While triaging detections, security analysts assess dozens of data points to determine the validity and criticality of a threat. This includes looking at how similar detections and entities have been previously triaged, context about the involved entities, the detection source, detection logic, attack stage, and many other data points. The Prioritization Engine automates many of these tasks using machine learning and other automated analysis techniques to continually learn and adapt based on the tenant context, global context, and security analyst actions. The following trends are also incorporated into the Threat Score.
Recent and Historical Trends of Similar Detections🔗
- Is this a new type of detection or is it frequently occurring?
- What is the accuracy of the detection?
- How often were they added to a case?
- How often were they NOT added to a case?
- How often were they resolved as True Positive: Malicious?
Recent and Historical Trends of Related Entities🔗
- How have detections with the entities been triaged previously?
- Have they been present in other detections that were added to a case?
- Have they been present in other detections that were NOT added to a case?
- Have they been present in other detections that were resolved as True Positive: Malicious?
Excluded Detections🔗
While all new detections will have a Threat Score, Informational, Low, and Medium severity detections are based on the original severity of the detection. For example, if one of these detections has a severity of 0.2, then the resulting Threat Score would be 2. This is necessary to ensure that detections can be sorted and filtered using the Threat Score. The following detections are also excluded from evaluation by the Prioritization Engine:
- Custom Detections
- The Threat Score assigned to custom detections is based on the severity of the detection as defined in the custom rule.
- Bring Your Own Threat Intelligence Detections
- Detections created from the Bring Your Own Threat Intel detector are also considered custom and are based on the severity of the detection.
- Suppressed Detections
- Suppressed detections are automatically resolved based on a defined rule and as such, a key component of what the engine learns from is missing from these detections.
Threat Score Evidence🔗
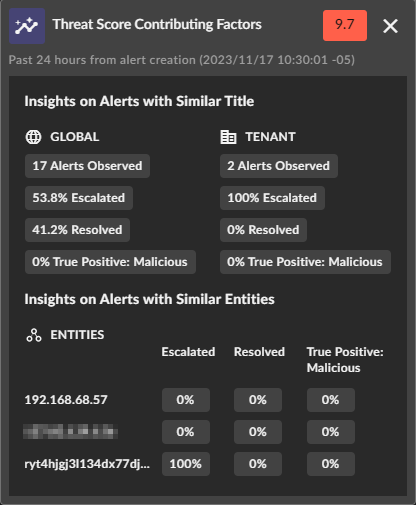
Each scored detection includes a summary of the key contributing factors used by the Prioritization Engine to calculate the Threat Score. The factors are separated into Global Insights, Tenant Insights, and Entity Insights, each showing how similar detections and entities have been triaged within the previous 24 hours. View these contributing factors by clicking the Threat Score within a detection table, detection summary panel, or detection details. In addition, the information is available on the Insights tab within detection details.
Note
Contributing factors may not be available on all detections; this is commonly the case with detections that are either not evaluated, are rare, or are infrequently triaged.
Contributing Factors Explanations🔗
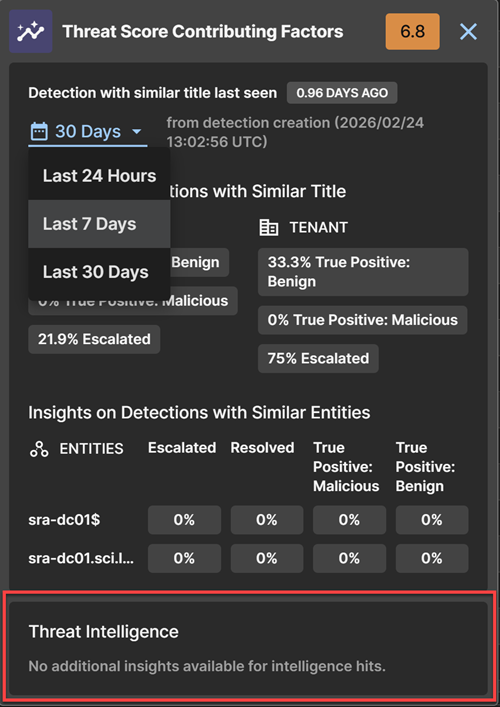
The contributing factor metrics are based on a rolling 24-hour window of data that allows you to quickly see how similar detections and their associated entities have been triaged recently.
Insights on Detections with Similar Title🔗
The Insights on Detections with Similar Title section helps you quickly see how other similar detections have been triaged recently, both globally and within your tenant.
- Global Insights — Insights from all tenants within the Taegis environment or region your tenant is located in
- Number of Detections Observed — The count of similar detections observed within the last 24 hours of detection creation across all tenants
- Percentage Escalated — The percentage of similar detections that were added to a case
- Percentage Resolved — The percentage of similar detections that were triaged and NOT added to a case
- Percentage True Positive: Malicious — The percentage of detections that were assigned a True Positive: Malicious status
- Tenant Insights — Insights from the tenant that the detection was created within
- Number of Description Observed — The count of similar detections observed within the last 24 hours of detection creation within your tenant
- Percentage Escalated — The percentage of similar detections that were added to a case
- Percentage Resolved — The percentage of similar detections that were triaged and NOT added to a case
- Percentage True Positive: Malicious — The percentage of detections that were assigned a True Positive: Malicious status
Insights on Detections with Similar Entities🔗
The insights on detections with similar entities allows you to quickly see how other detections where the entity was present were triaged recently.
- Percentage Escalated — The percentage of detections where the entity was present that were added to a case
- Percentage Resolved — The percentage of detections where the entity was present that were triaged and NOT added to a case
- Percentage True Positive: Malicious — The percentage of detections that were assigned a True Positive: Malicious status
Tip
It is expected that the percentages may not add up to 100%. Open detections are not included in the triage calculations as a decision has not been made on them yet.
Threat Intelligence🔗
Entities with associated threat intelligence hits from VirusTotal and APIVoid are factored into the Threat Score calculation and displayed in the Threat Score Contributing Factors panel and the Detection Insights tab. Use this information to prioritize investigations. Higher Threat Scores with confirmed TI hits warrant higher urgency, especially when corroborated by multiple sources.
Interpreting Contributing Factor Insights🔗
Insights provide context about the detection and the associated entities without requiring you to manually search for the information. Below are some examples of how one might interpret the presented insights to aid in the analysis process:
-
High Global Observed Count & High Global Resolved Percentage
- A high count of observed detections globally and a high resolved percentage may indicate:
- This is a frequently occurring detection and may be false positive detection.
- A detection spike occurred due to a bad signature.
- A detection spike occurred due to authorized or benign activity.
- A high count of observed detections globally and a high resolved percentage may indicate:
-
High Global Observed Count & High Global Escalated Percentage
- A high count of observed detections globally and a high escalated percentage may indicate:
- A widescale attack is occurring across multiple customers.
- A high count of observed detections globally and a high escalated percentage may indicate:
-
Low Global Observed Count & High Global Escalated Percentage
- A low count of observed detections globally and a high escalated percentage may indicate:
- A new or infrequent attack has been observed and it may be a legitimate threat.
- A new or infrequent attack has been observed that may require additional analysis to arrive at a conclusion.
- A low count of observed detections globally and a high escalated percentage may indicate:
-
Same Global & Tenant Observed Counts
- The type of detection is rare and has only been observed within your tenant recently.
-
High Entity Resolved Percentage
- The entity has been seen in other detections recently and those may have been false positive detections.
-
High Entity Escalated Percentage
- The entity has been seen in other detections recently that may have been related to a legitimate threat.
Threat Score and Detection Severity Comparison🔗
Threat Score🔗
Whereas detection severity often represents the severity of a threat universally, the Threat Score represents the threat level tailored to your unique organization. By combining multiple factors observed within your tenant and from the Taegis global threat landscape, security analysts are provided a comprehensive score to prioritize which threats they should focus on first.
Detection Severity🔗
Depending on the detector or source of detection, the severity may be set based on an algorithm, the originating security control, or by a security researcher that authored the countermeasure. The important thing to note is that severity is traditionally assigned to represent the severity of the threat if it were to be successful agnostic of the organizational context. Since each organization is unique and important context is often missing, severity alone is not a dependable measure security analysts should use to decide where to focus their attention, yet this is how the industry has been operating for decades. For more details on detection severity, see Detection Severity and Confidence.