Remediation Time Panel🔗
This article provides an overview of the information displayed in the Remediation Time panel.
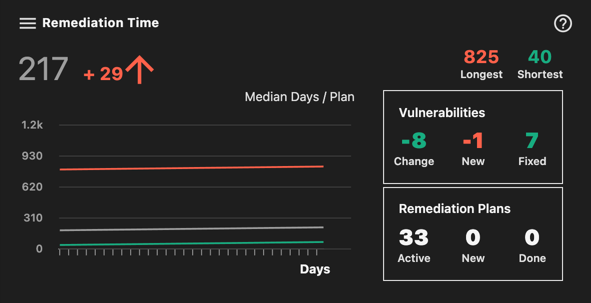
The Remediation Time panel displays the following metrics:
-
The average remediation time in days and its evolution (increase/decrease) over the selected time frame (arrow pointing up or down). In the main graph, this metric is visualized as the black line.
-
The longest and shortest remediation times over the selected time frame. In the main graph, these metrics are visualized as the green and red lines.
-
The variation of the number of vulnerabilities in Remediation Plans that are new or fixed.
-
The number of Remediation Plans that are active, new, or done (closed).