My Dashboards🔗
Note
The terms Alerts and Investigations have recently been changed to Detections and Cases in Taegis XDR. You may still see references to the old terms while we continue to work towards platform convergence of Sophos and Taegis technologies. For more information, see Taegis Terminology Updates.
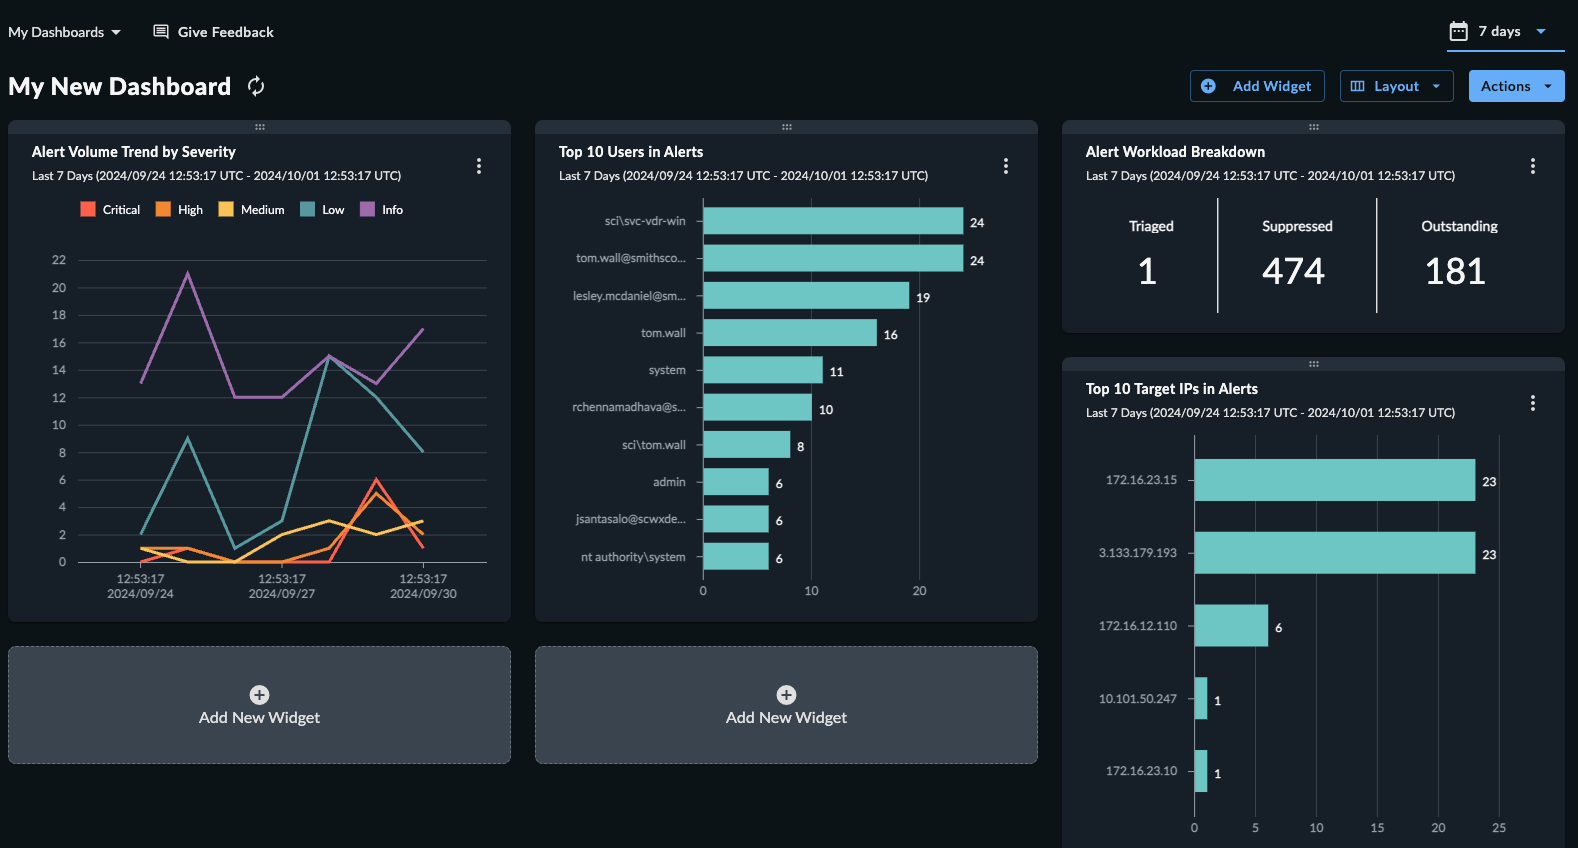
My Dashboards is where you can create custom dashboards. Custom dashboards enable you to prioritize the data visualizations most relevant to you, through preconfigured widgets and a drag-and-drop interface. Custom dashboards are user specific, and each user can configure as many as they wish.
Tip
If you are opted in to Preview mode, you can now share a custom dashboard tenant wide or with individual users and create custom widgets.
Access My Dashboards🔗
To access your custom dashboards, select Dashboards from the Taegis Menu and choose My Dashboards.
Each custom dashboard can be loaded from the My Dashboards drop-down menu at the top of the page.
Create a New Dashboard🔗
To create a new custom dashboard:
-
Open the My Dashboards drop-down menu and select Create Dashboard.
-
The dashboard is created. Select Add New Widget to start populating the dashboard with preconfigured widgets. Users opted in to Preview mode can also create custom widgets.
Tip
Copy an existing custom dashboard into a new one by selecting More Options > Duplicate Dashboard.
Preconfigured Widgets🔗
The following preconfigured widgets are available for custom dashboards. Users opted in to Preview mode can also create custom widgets.
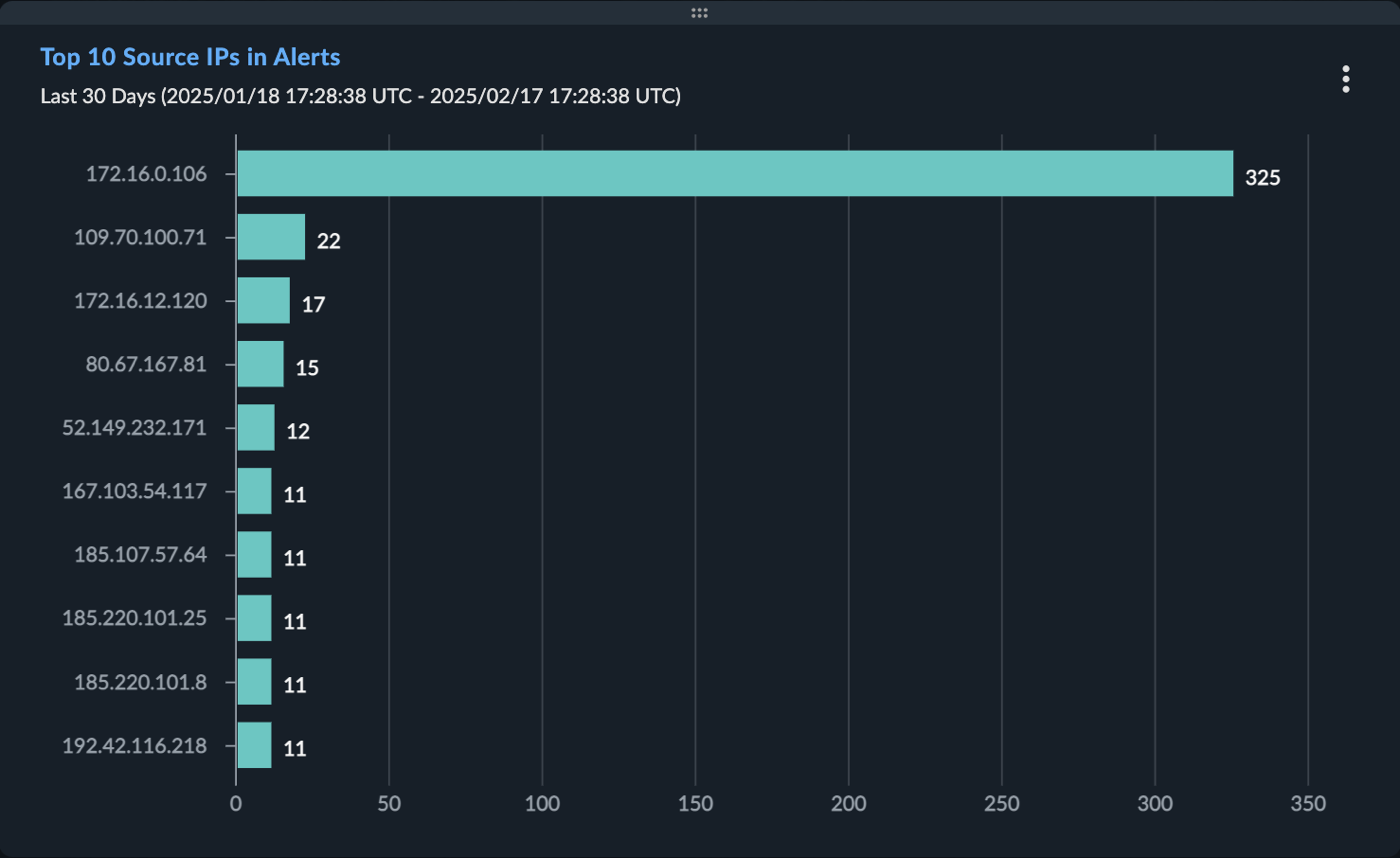
Top 10 Source IPs in Detections🔗
The Top 10 Source IPs in Detections widget displays the top 10 IP addresses that appear as the source of detections.
This provides a sense of whether there is an egregious offender across all detections.
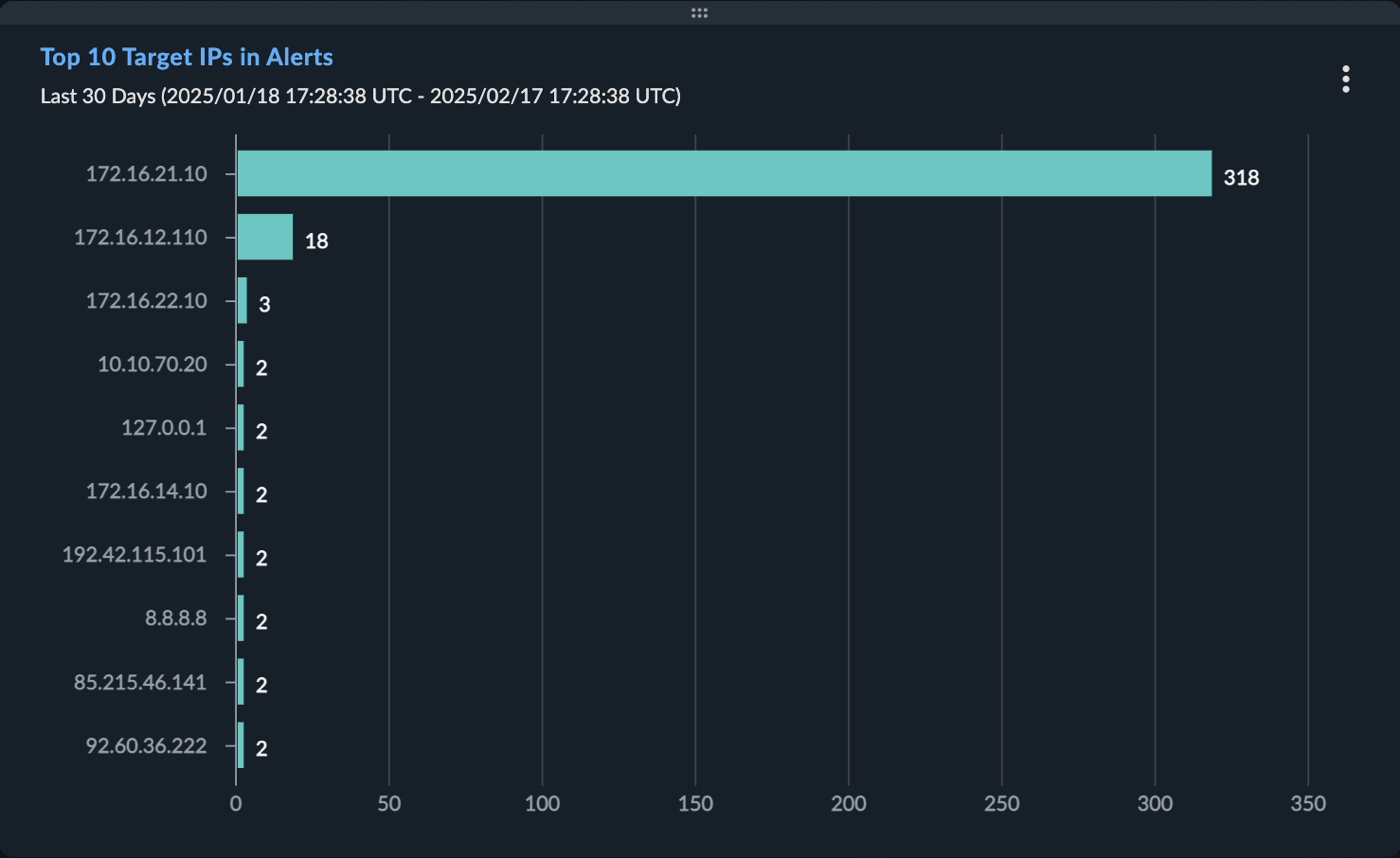
Top 10 Target IPs in Detections🔗
The Top 10 Target IPs in Detections widget displays the top 10 IP addresses that appear as the destination of detections.
This helps identify the most commonly targeted assets across all detections.
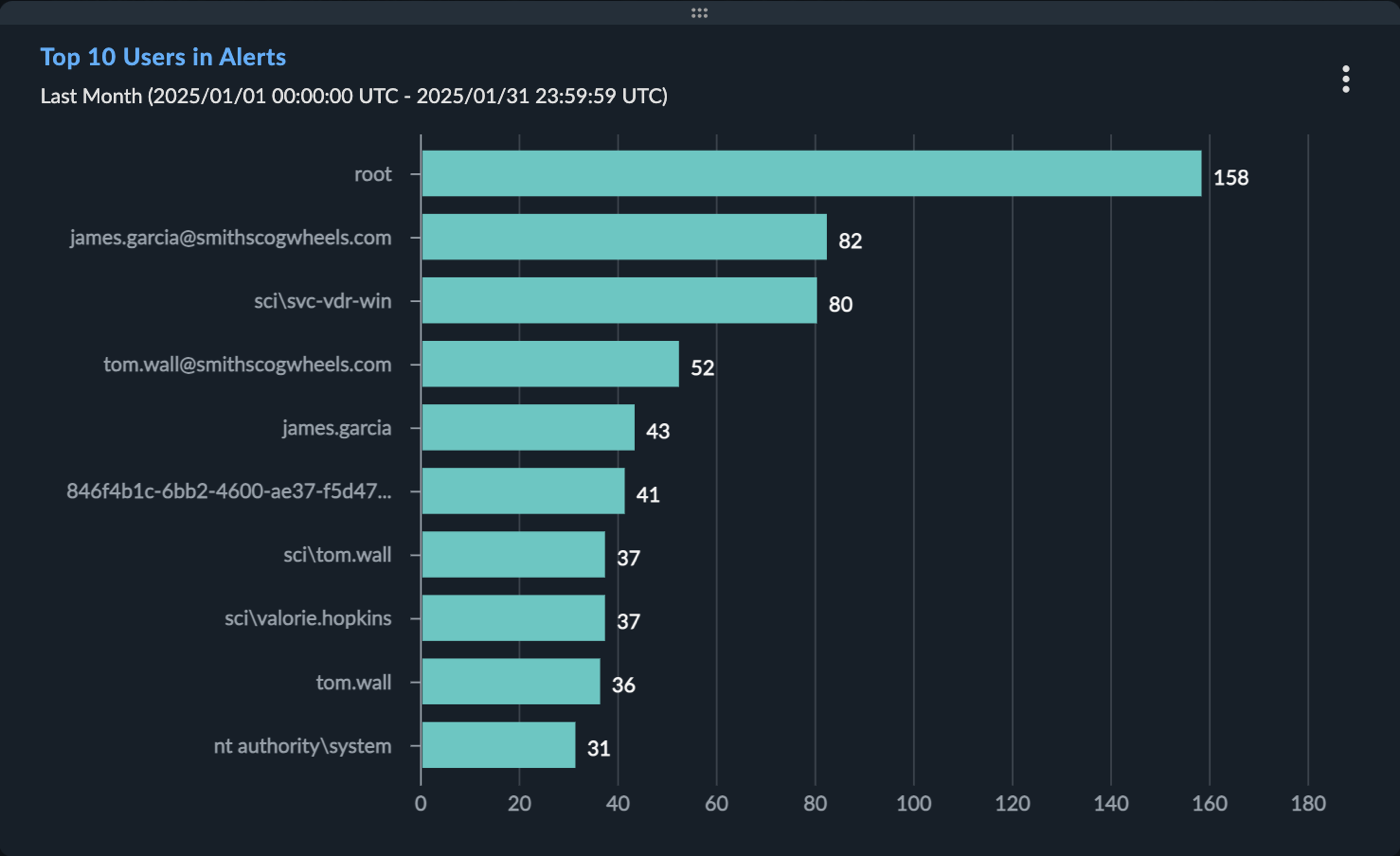
Top 10 Users in Detections🔗
The Top 10 Users in Detections widget displays the top 10 usernames that appear in detections.
This indicates whether there is a more at-risk user in the environment.
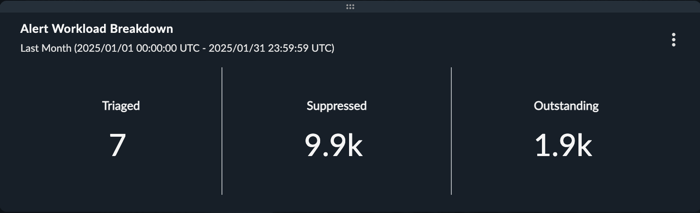
Detection Workload Breakdown🔗
The Detection Workload Breakdown widget displays the total number of detections, broken down by those that have been triaged by analysts, suppressed by detection rules, and those that are open or ongoing.
This indicates the volume of detections handled by security analysts vs. saved by Secureworks® Taegis™ XDR vs. awaiting review.
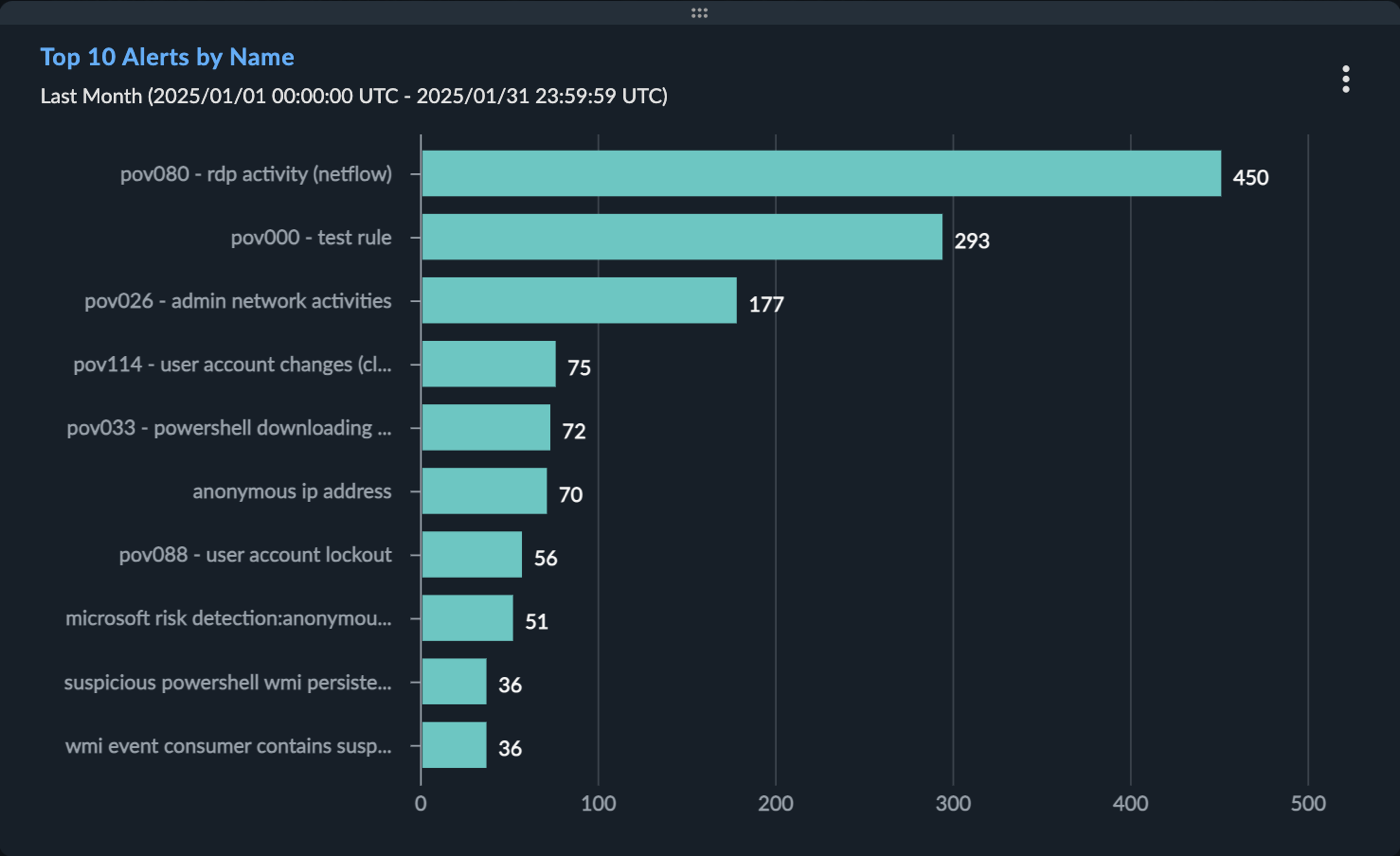
Top 10 Detections by Name🔗
The Top 10 Detections by Name widget displays the top 10 detections by title.
This provides insight on whether a common tactic has been leveraged across all detections.
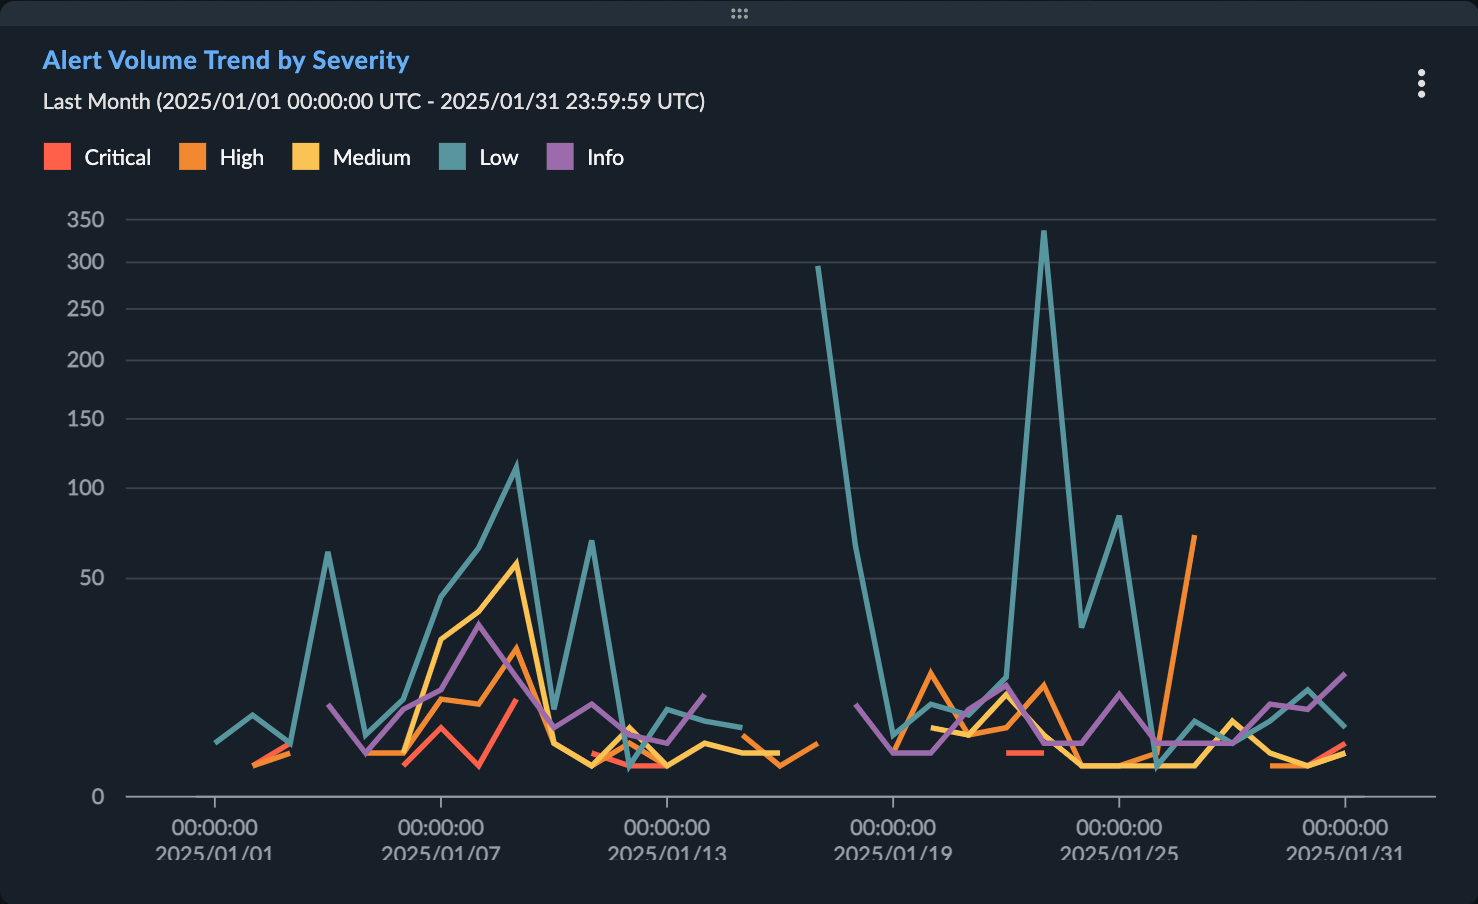
Detection Volume Trend by Severity🔗
The Detection Volume Trend by Severity widget displays the total number of detections created, grouped by severity.
This highlights the proportion of detection severities over time.
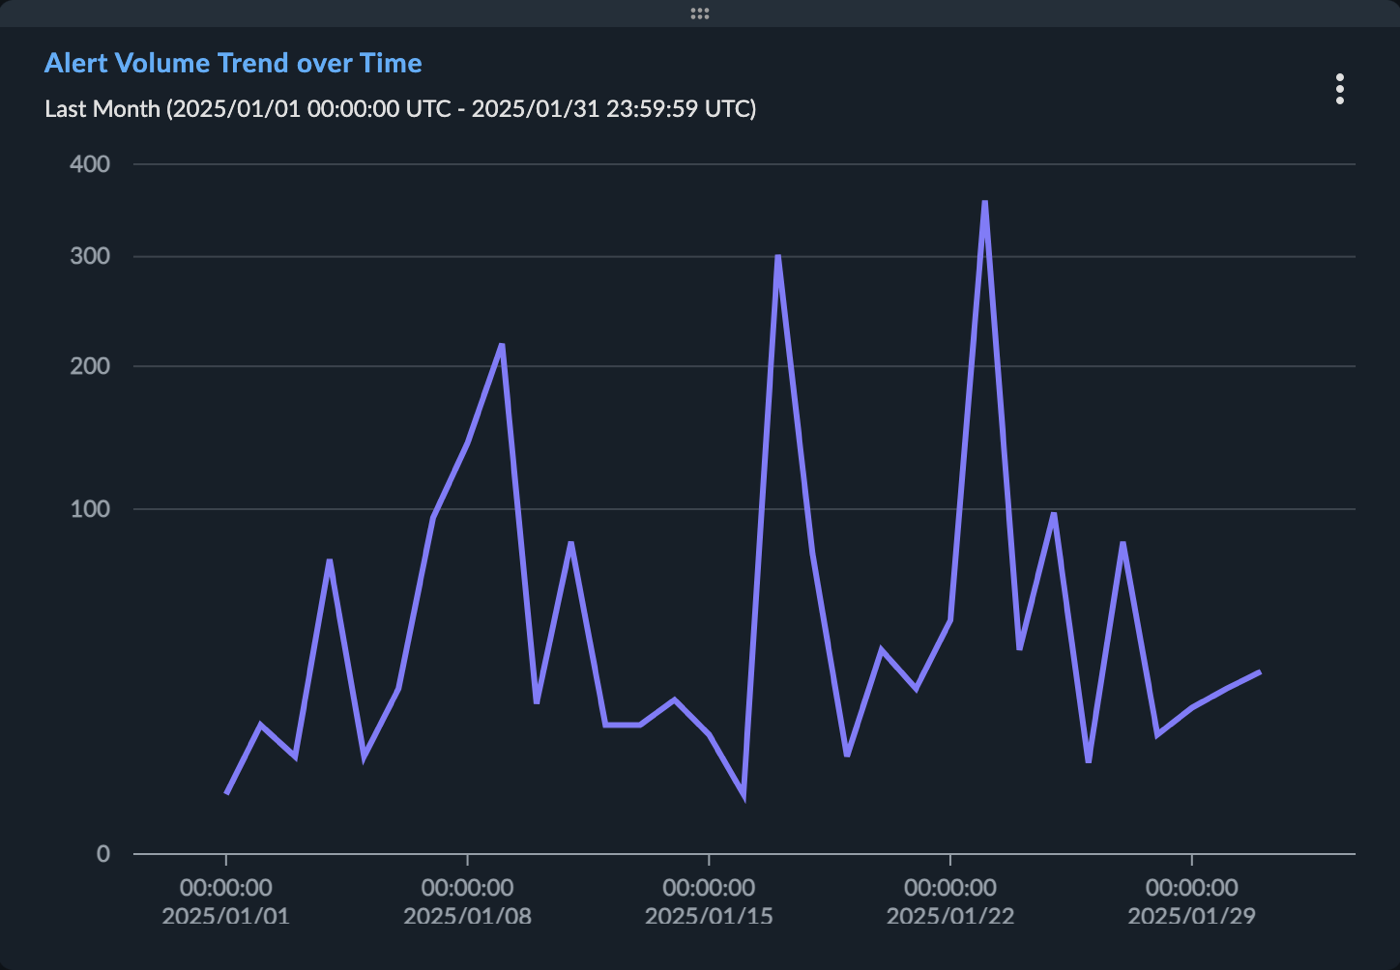
Detection Volume Trend over Time🔗
The Detection Volume Trend over Time widget displays the total number of detections created.
This depicts increasing/decreasing trends in detection creation or abnormal spikes/deficits in detection activity.
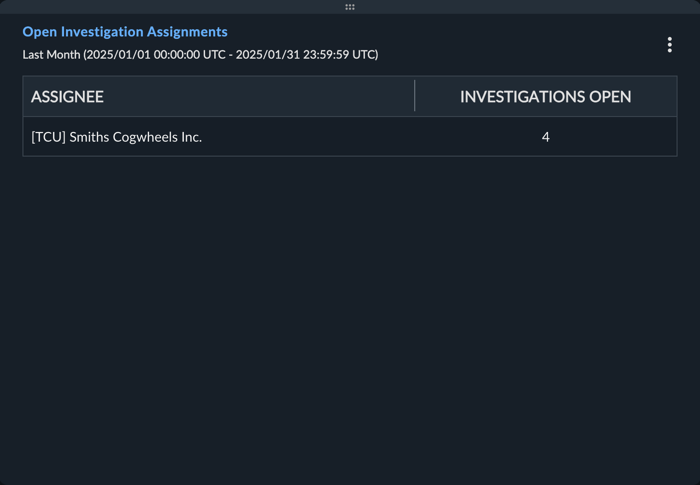
Open Case Assignments🔗
The Open Case Assignments widget displays a list view indicating the quantity of open cases for each assignee.
This highlights which users have cases that need to be resolved.
MITRE ATT&CK Detection Heatmap 🔗
The MITRE ATT&CK Detection Heatmap widget maps your detections to MITRE ATT&CK V9 Enterprise techniques. This helps identify the most commonly observed MITRE ATT&CK techniques across all detections and allows for quick filtering of detections by technique.
The heatmap depicts the volume of techniques observed in your environment. An empty cell indicates that the technique was not observed during the chosen time frame. A colored cell indicates the technique was observed, with increasing detection counts visualized with increasing color brightness.
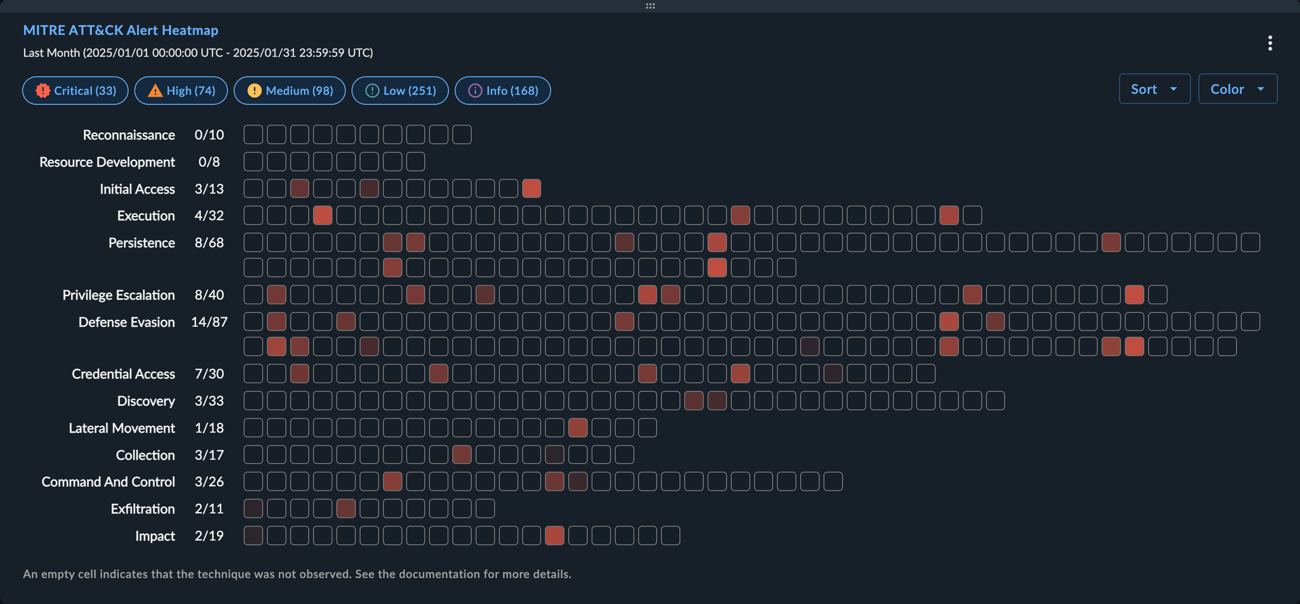
Adjust the Heatmap🔗
Select a detection severity filter chip from the top of the widget to remove or add detections of that severity to the heatmap.
Select the Sort menu to adjust the sort of techniques, and use the Color menu to change the color used in the heatmap.

Analyze the Heatmap🔗
Hover over a cell to view the technique name and detection count. Select a cell to open a popup with the description of the technique, and for those that are mapped to detections, a stacked bar chart depicting the volume of the applicable detections by severity.
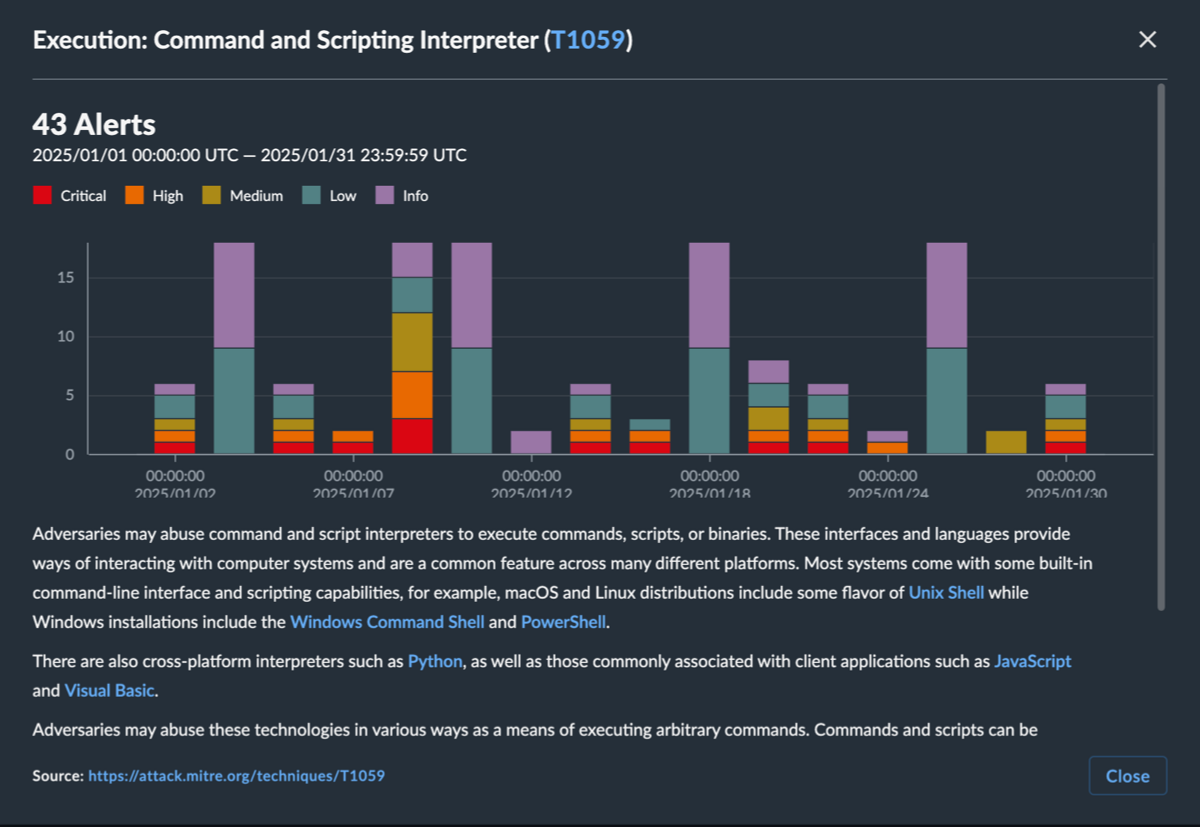
The expanded view of the widget includes a table of the underlying detections. From this view, select one or more cells to filter the table below the widget to just those applicable detections.

Detection Flow 🔗
The Detection Flow widget uses the aggregation of detection data from your environment to visualize the frequencies of various categorical data and how these categories connect.
This allows you to both see the frequency of this detection data and interactively explore and analyze the connections between each category. For example, you can analyze how many detections with high threat scores of 8-10 end up with a particular status, or how many detections generated by a specific detector result in a particular threat score.
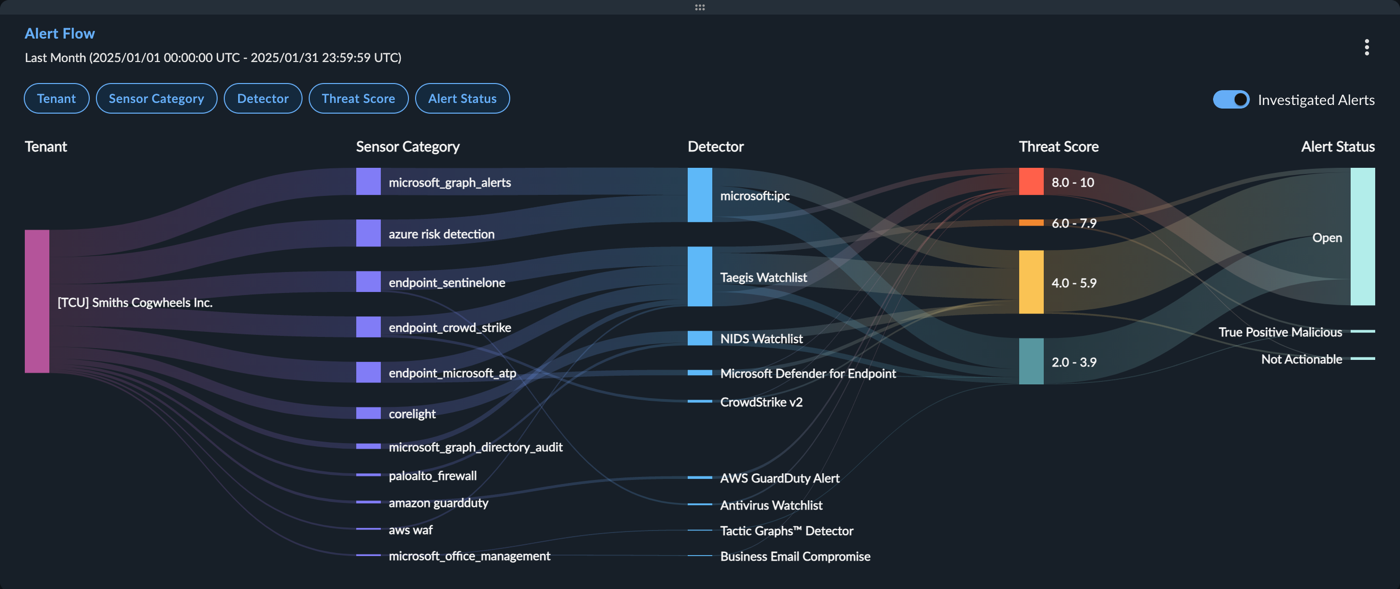
Adjust the Diagram🔗
Select a filter chip from the top of the widget to remove or add that column in the visualization.
Toggle the Investigated Detections setting to On at the top right to include only detections added to a case, or to Off to include only detections that have not been added to a case from the chosen time frame in the diagram. This defaults to On.

Analyze the Diagram🔗
Hover over a node or the path between nodes to view the count of applicable detections.
The expanded view of the widget includes a table of the underlying detections. From this view, select a node or path to filter the table below the widget to just those applicable detections.

Case Flow 🔗
The Case Flow widget uses the aggregation of case data from your environment to visualize the frequencies of various categorical data and how these categories connect.
This allows you to both see the frequency of this case data and interactively explore and analyze the connections between each category. For example, you can analyze the connection between cases by a specific creator and the volume of each case status.
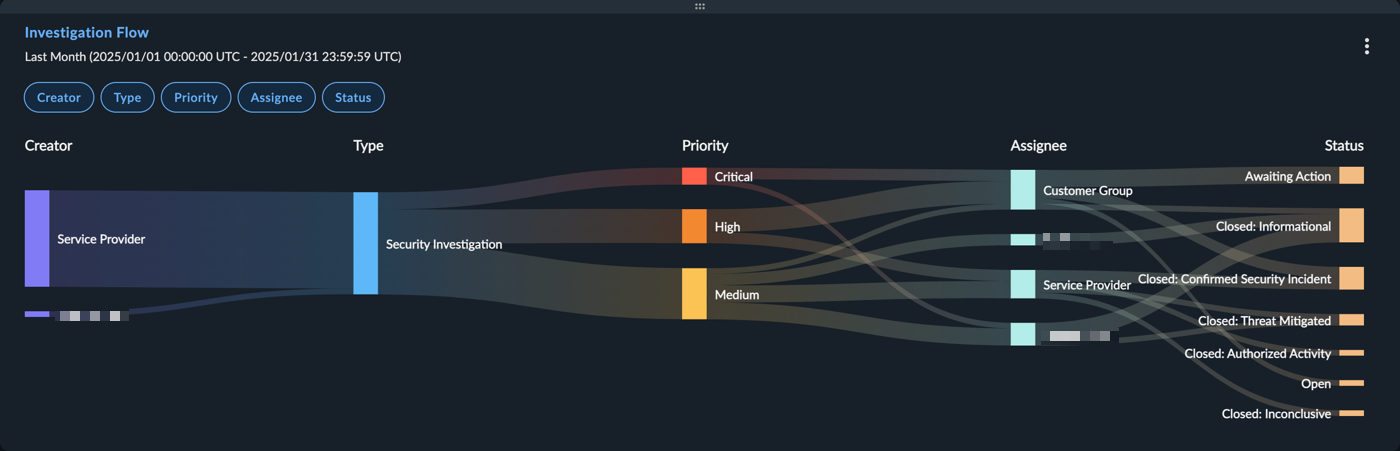
Adjust the Diagram🔗
Select a filter chip from the top of the widget to remove or add that column in the visualization.

Analyze the Diagram🔗
Hover over a node or the path between nodes to view the count of applicable cases.
The expanded view of the widget includes a table of the underlying cases. From this view, select a node or path to filter the table below the widget to just those applicable cases.

Custom Widgets 🔗
For users opted in to Preview mode, custom widgets allow you to create visualizations of the data that matters to you. The custom widgets you create can be added to as many of your custom dashboards as you wish and are available to users in your tenant also opted in to Preview mode.
Notes on current limitations:
- Custom widgets can only be added to custom dashboards found under My Dashboards from the Taegis Menu.
- Only the user who created a custom widget or a Tenant Admin can edit or delete it, and any changes made are applied to every instance of the widget, wherever it appears.
- Any user opted in to Preview mode in the tenant the widget was created in can see and use the custom widget.
We value your input on additional enhancements you would like to have available for use with Custom Widgets. See Submit a New Idea to add your input to our Product Roadmap.
Create a Custom Widget🔗
The data visualized by a custom widget is generated by an Advanced Search query. You can form a new query or use an existing query to create your widget from My Dashboards.
To create your custom widget:
- Open Dashboards from the Taegis Menu and choose My Dashboards.
- Select + Add Widget to open the Widget Library.
- Select Create New Widget to open the Widget Builder.
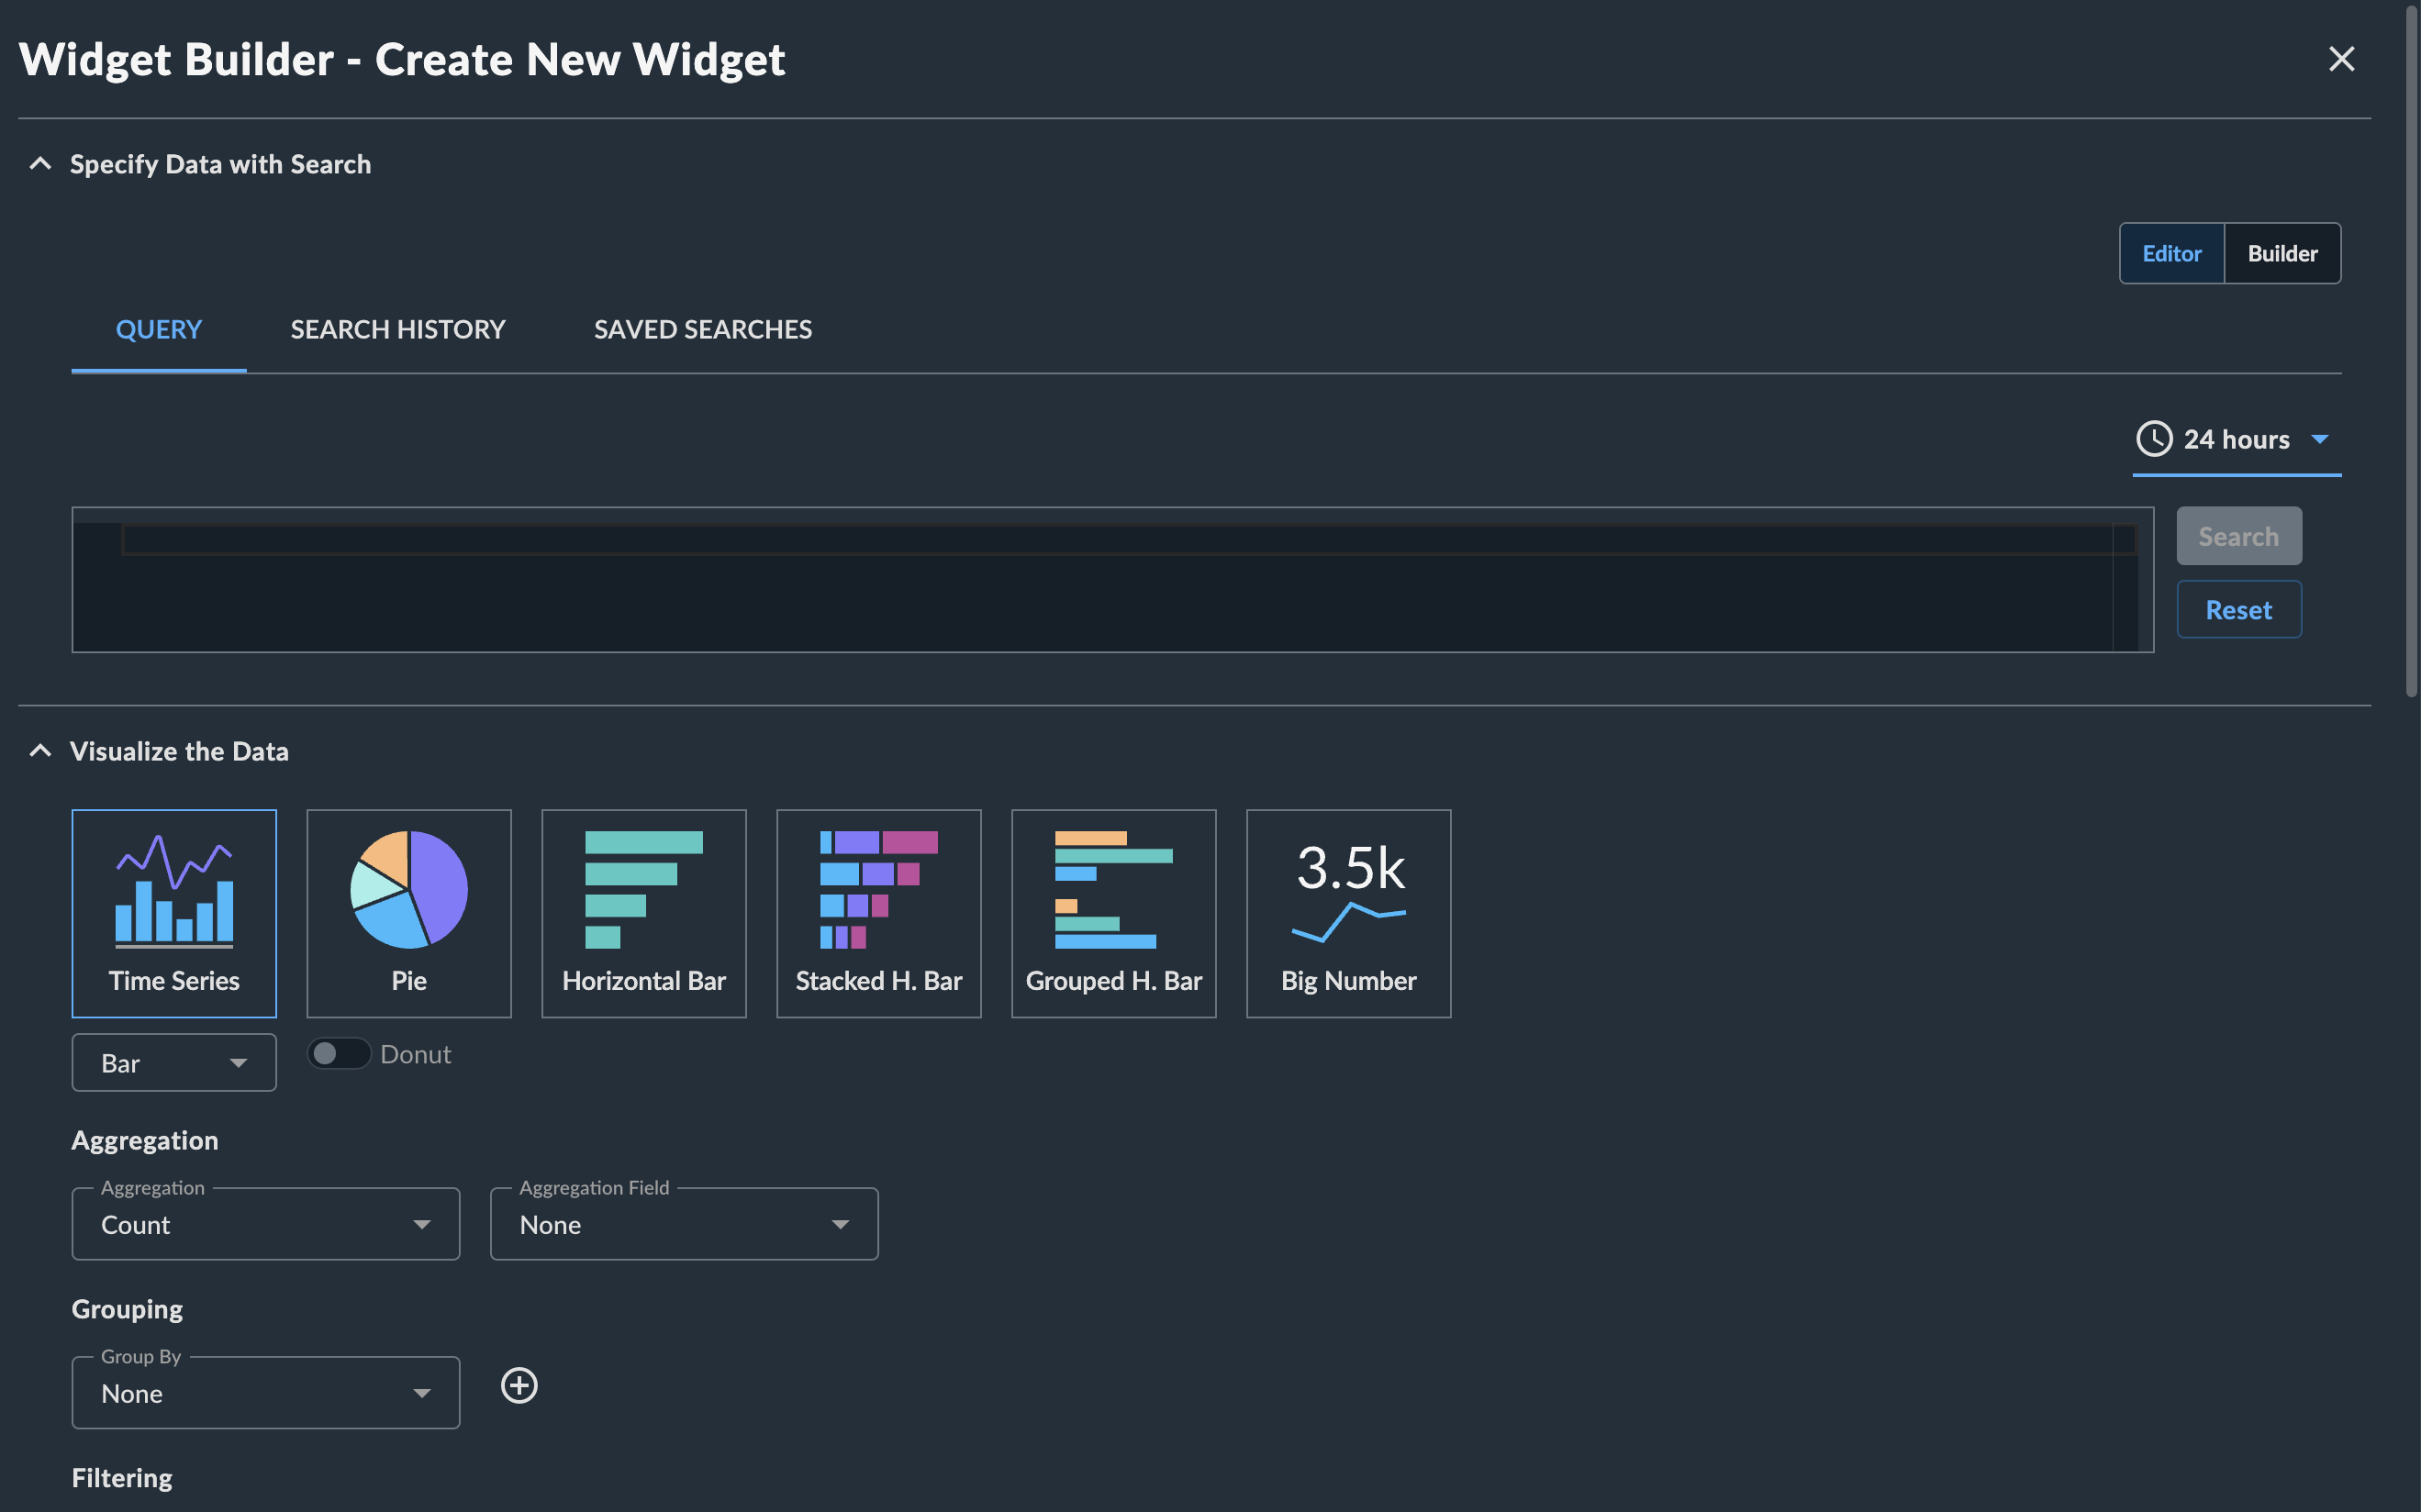
The Widget Builder is divided into four collapsible sections. Follow the instructions in each of the following sections to create your custom widget.
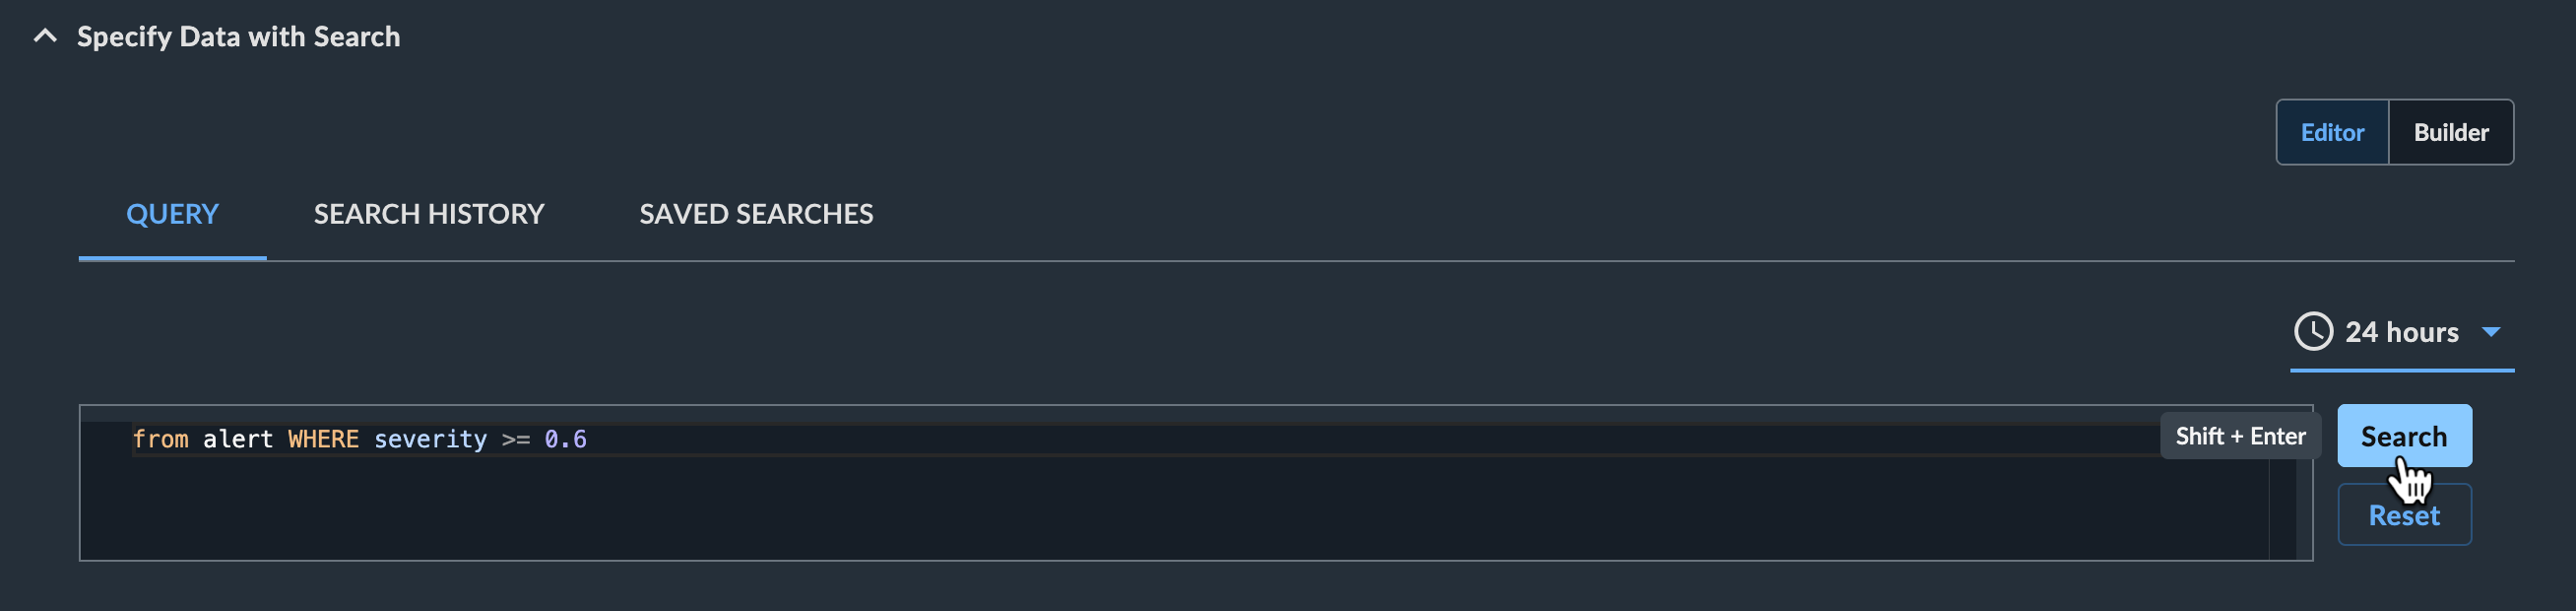
Specify Data with Search🔗
To specify the data you would like to visualize with the widget:
- From the Specify Data with Search section of the Widget Builder, enter a search query or select an existing query from Search History or Saved Queries. You can use either the Query Editor or Builder by selecting the desired option from the top of the section.
- Select Search to execute the query and populate the Widget Preview with a visualization of the search results.
Visualize the Data🔗
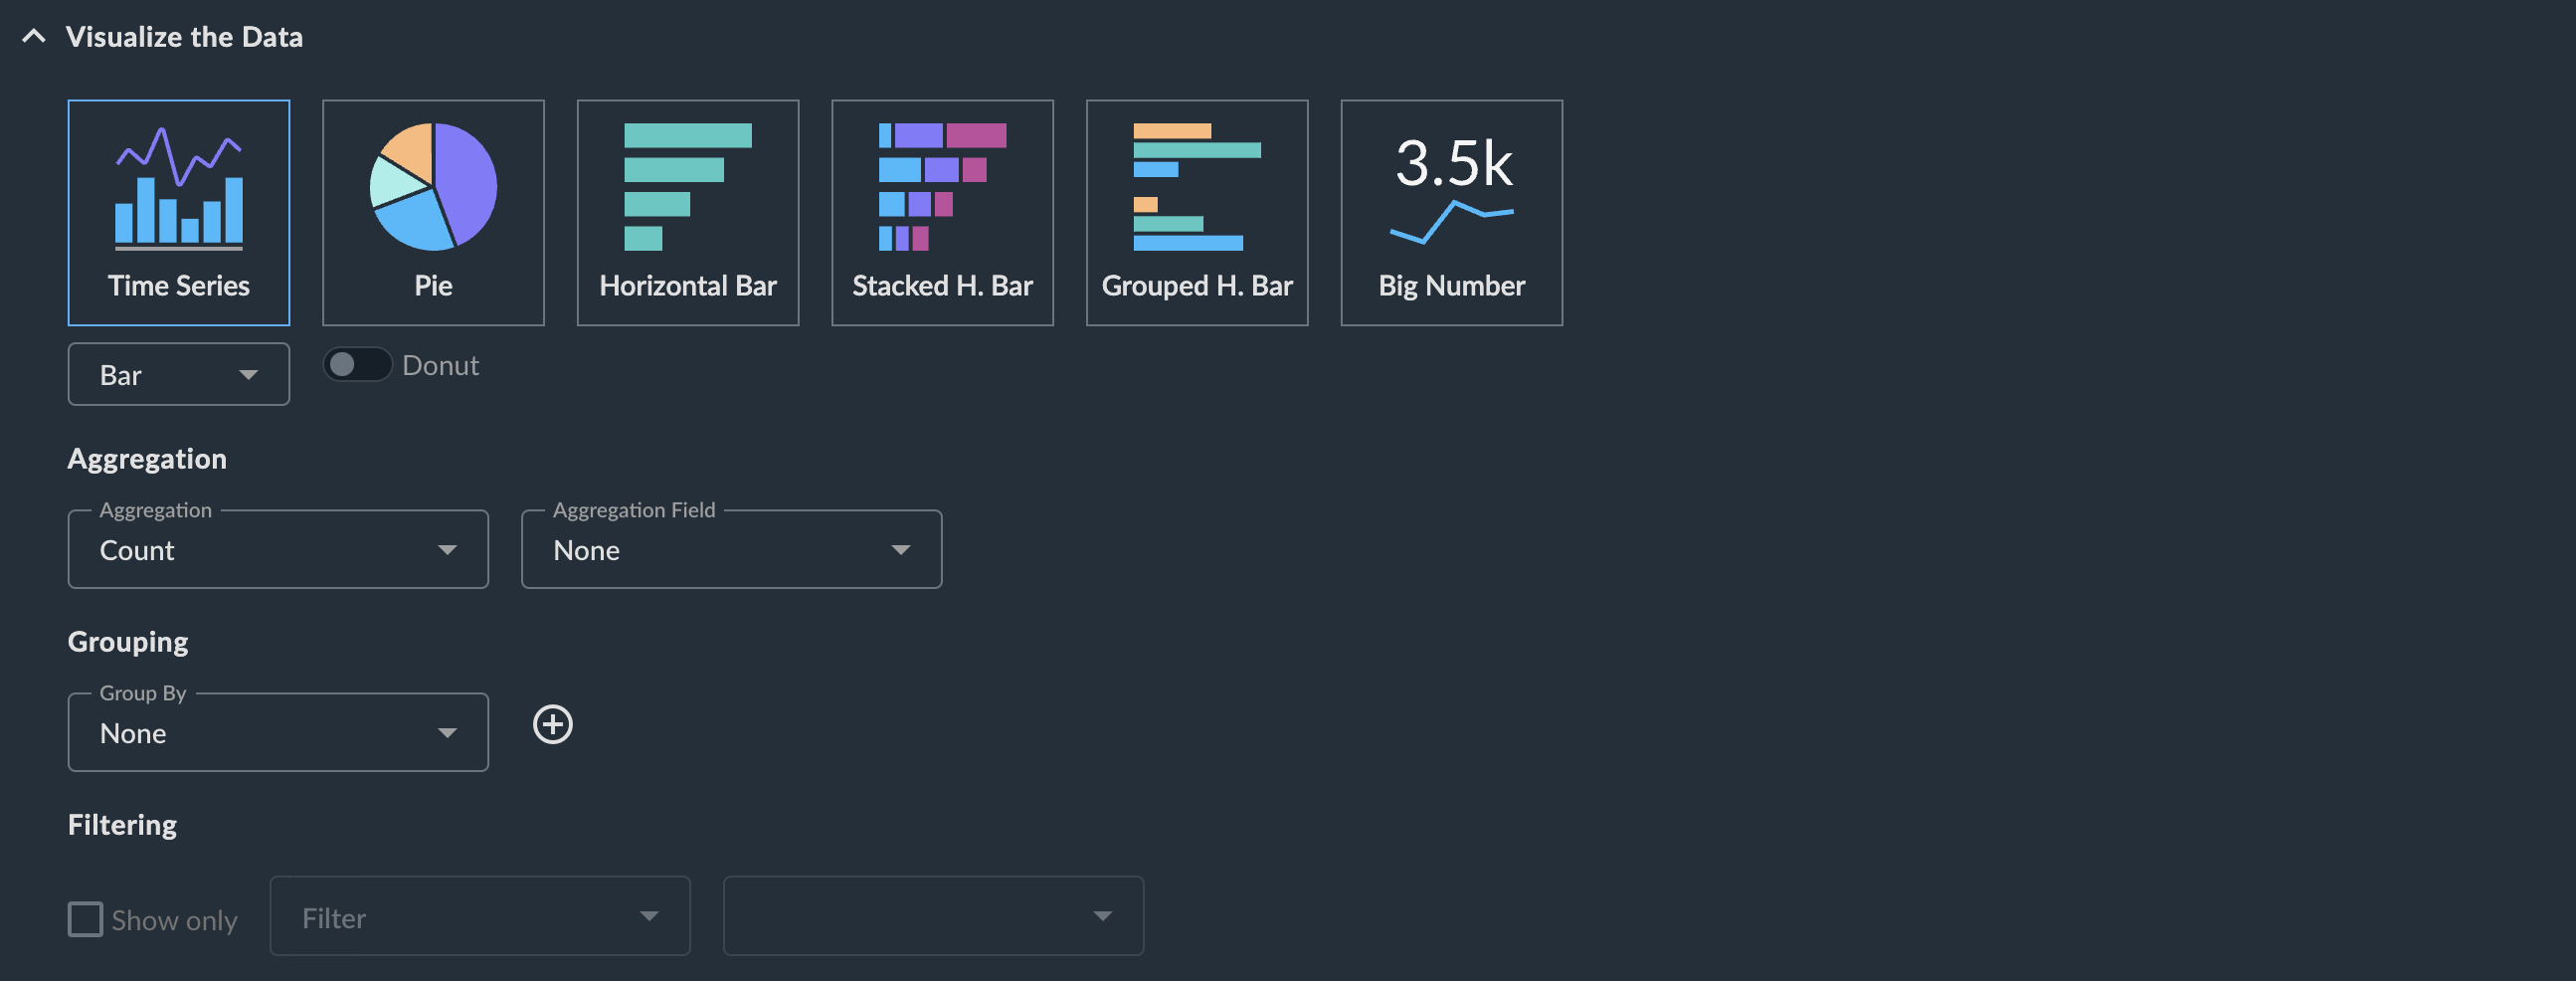
A widget contains multiple properties that can be adjusted depending on the data you’d like to visualize.
Tip
The Widget Preview updates to allow for quick visual reference while configuring the widget. The preview uses the date range from your search query, but your completed widget will use the date range set for the entire custom dashboard, just as the predefined widgets do.
-
Select the type of visualization to be used by the widget. The available options are:
-
Time Series (default) — Ideal for displaying data over time to identify trends, patterns, and anomalies; available as a bar, line, or area chart
-
Pie — Ideal for showing the proportional distribution of categories relative to a whole; available as a pie or donut chart
- Horizontal Bar — Ideal for comparing quantities across different categories
- Stacked Horizontal Bar — Ideal for comparing the total and component parts of different categories side by side
- Grouped Horizontal Bar — Ideal for comparing multiple sub-categories across different main categories
- Stacked Vertical Bar — Ideal for showing the total and breakdown of categories over time or across different groups (this visualization is used when you select Time Series with bar chart format and select a Group by field)
- Big Number — Ideal for highlighting a single, important metric or key performance indicator at a glance
-
-
Choose how to aggregate the search results in your chosen visualization and which field to aggregate by using the Aggregation drop-down menus. The available fields are dependent on the fields available in your search results.
- Choose a Group by option to define the data categories used by the visualization. The available fields are dependent on the fields available in your search results.
- Choose to Filter the results to a set amount like the top ten results by selecting the Show only box and choosing the desired filter and amount.
Date Range Options🔗
Currently, the widget will visualize data using the date range set for the entire custom dashboard, just as the predefined widgets do. Additional options will be available in a future release.
Name and Description🔗
- Enter the Title and Description that is used to identify the widget and its purpose in the Widget Library and on your dashboard.
- Enter an optional Footnote that displays below the widget visualization.
Complete the Widget🔗
Select Create Widget to save it to the Widget Library. You and other tenant users opted in to Preview mode can now add the custom widget to any of your custom dashboards.
Delete a Custom Widget🔗
The widget creator or a Tenant Admin can fully delete a custom widget, including all instances of its use on all tenant users’ custom dashboards. Follow these steps:
- Open Dashboards from the Taegis Menu and choose My Dashboards.
- Select + Add Widget to open the Widget Library.
- From the Widget Library, choose the Custom tab.
- Select the menu icon for the desired widget and select Delete.
- Select Yes, Delete to confirm you would like to permanently delete the custom widget and remove all instances of its use.
Tip
To remove an instance of the widget instead, see Remove a Widget.
Edit a Custom Widget🔗
The widget creator or a Tenant Admin can edit a custom widget, which affects all instances of its use on all custom dashboards. Follow these steps:
- Open Dashboards from the Taegis Menu and choose My Dashboards.
- Select + Add Widget, choose the Custom tab, and select the menu icon for the desired widget.
- Choose Edit to open the Widget Builder with the selected widget’s configuration populated.
- Make your desired changes and select Save Changes when complete.
Important
All instances of the widget on all tenant users’ custom dashboards will update to use the new configuration.
Duplicate a Custom Widget🔗
To create a new custom widget with an exact copy of a current custom widget’s configuration, follow these steps:
- Open Dashboards from the Taegis Menu and choose My Dashboards.
- Select + Add Widget to open the Widget Library.
- From the Widget Library, choose the Custom tab.
- Select the menu icon and choose Create a Copy.
- A new widget is added to the Custom tab of the Widget Library with (Copy) appended to the title to differentiate it from the original.
- Edit the widget to update the title and change the configuration as desired.
Expand a Widget🔗
For supported widgets, open an expanded view that includes a table of the underlying data by selecting the widget's Menu icon and choosing Expand, or by selecting the widget title.

Dashboard Sharing 🔗
Users opted in to Preview mode can now share their custom dashboards with other tenant users.
Dashboard Access Levels🔗
Your access level to custom dashboards shared with you by other tenant users varies depending on the permissions set when shared. Your level of access is displayed as a badge next to the dashboard name. Hover over the badge to view the dashboard owner’s name.
The following table details possible access levels and the included permissions.
| Access Level | Dashboard Permissions | Sharing Permissions |
|---|---|---|
| Owner | All actions available | All actions available |
| Editor | Can’t delete dashboard | Can’t transfer ownership |
| Viewer | Can’t delete, edit, or adjust dashboard | Can’t remove own access; Can only grant Viewer access |
Share a Custom Dashboard🔗
By default, access to new custom dashboards is restricted to the creator. To share a custom dashboard with other users in your tenant, select the Share button at the top of the page. You can update permissions at tenant-wide level affecting all tenant users and at an individual user level.
Once you have adjusted access to the dashboard, select Copy Link from the Share panel to share with users. The link itself does not have any access embedded, so only the users affected by your choices in the Share panel will be able to access the dashboard with the link.
Notifications🔗
Only users who have enabled the dashboard notification preference in their Profile & Settings will receive an in-app and email notification when they are initially granted access to a dashboard or when ownership of a dashboard is transferred to them.
Notifications are not sent for tenant-level access changes or when a user’s access level changes or is removed.
Share with Tenant🔗
To adjust the tenant-wide access permissions to a custom dashboard, follow these steps:
- Select the desired custom dashboard from the My Dashboards drop-down menu at the top left of the page.
- Select Share from above the dashboard.
-
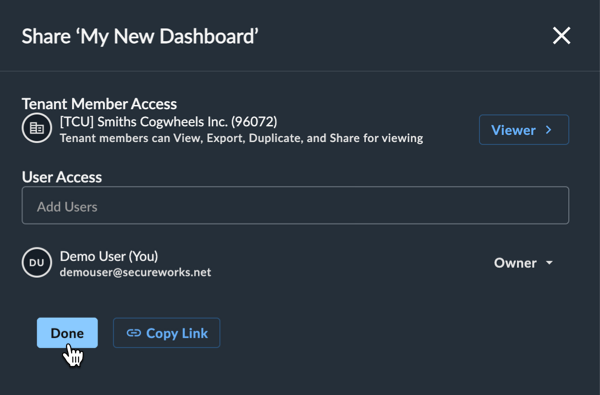
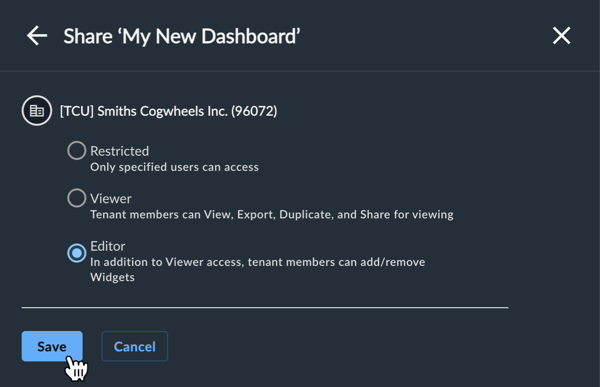
From the Tenant Member Access section of the Share panel, select the default Restricted level and choose the desired access level for all tenant users:
- Restricted: Only users specified in the User Access section of the Share panel can access the dashboard.
- Viewer: Any tenant member can view, duplicate, export, and share the dashboard for viewing.
- Editor: In addition to Viewer access, any tenant member can edit and adjust the dashboard.
Share with Tenant -
Select Save to save your changes and return to the Share panel and then choose Done.
Note
Users with Viewer permissions to a dashboard cannot adjust tenant-wide permissions.
Share with Individuals🔗
To adjust the individual user access permissions to a custom dashboard, follow these steps:
- Select the desired custom dashboard from the My Dashboards drop-down menu at the top left of the page.
- Select Share from above the dashboard.
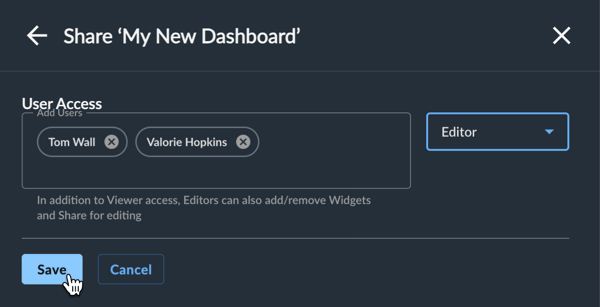
- From the User Access section of the Share panel, begin typing a name in the Add Users field and then select the desired user from the list.
- Continue to add more users if desired.
-
Choose the desired access level for the user(s) from the drop-down menu:
- Viewer: Can view, duplicate, export, and share the dashboard for viewing
- Editor: In addition to Viewer access, can edit and adjust the dashboard
Share with Individuals -
Select Save to save your changes and return to the Share panel and then choose Done.
Important
User permissions override tenant-level permissions.
Note
Users with Viewer permissions to a dashboard can only grant Viewer access to other users.
Change or Remove Access🔗
To change another user’s access permissions to a custom dashboard or remove their access completely, follow these steps:
- Select the desired custom dashboard from the My Dashboards drop-down menu at the top left of the page.
- Select Share from above the dashboard.
- From the User Access section of the Share panel, select the permission drop-down menu for the desired user.
- Select the desired access level for the user or choose Remove Access and then confirm the action.
- The Share panel updates to reflect your changes. Select Done when complete.
Note
Users with Editor permissions can also change or remove their own access. Viewers cannot change or remove other users’ access, but can remove their own access.
Important
When an individual user's access is removed, the user still retains the permissions set tenant wide under Tenant Member Access. For example, if the Tenant Member Access for the dashboard is set to Viewer, and you remove an individual’s Editor User Access, that individual retains the Viewer permission set tenant wide.
Transfer Ownership🔗
To transfer ownership of a custom dashboard to another user, follow these steps:
- Select the desired custom dashboard from the My Dashboards drop-down menu at the top left of the page.
-
Select Share from above the dashboard, and choose one of the following paths from the User Access section of the Share panel:
- Select the permissions drop-down menu for yourself, choose Transfer Ownership, and then enter the name of the user to transfer ownership to in the Choose a User field.
- Or, select the permissions drop-down menu for the desired user to transfer ownership to and choose Transfer Ownership.
-
Choose the level of access you wish to have after transferring ownership.
- Select Transfer Ownership.
Note
Only the Owner of a dashboard can transfer ownership.
Customize a Dashboard🔗
Note
For users opted in to Preview mode, your ability to customize dashboards that have been shared with you by other users depends on your access level.
You can customize the following dashboard elements.
Rename the Dashboard🔗
Select the title of the dashboard to give it a new name.
Edit the Dashboard Layout🔗
Select Edit Layout and choose your preferred layout view: One Column, Two Columns, or Three Columns.
Rearrange Widgets🔗
Drag and drop widgets to rearrange them as needed.
Remove a Widget🔗
Select the widget's Menu icon ![]() and choose Remove Widget to remove it from your dashboard.
and choose Remove Widget to remove it from your dashboard.
Change Time Frame🔗
Change the time frame of all widgets using the drop-down control at the top right of the dashboard. The default time period is the Last 7 Days, but choosing a custom time period overwrites it. The most recent time period selected becomes the new default.
Create One-Time Report🔗
You can take a snapshot of the current custom dashboard in a PDF report. To generate a one-time PDF report from a custom dashboard:
- Customize the dashboard widgets as needed. All edits to the dashboard, including the name, date range, and order of the widgets are reflected in the report.
- Select More Options > Create One-Time Report.
- The report is generated. You will receive a notification when it is ready to download, or proceed to Reports from the Taegis Menu to watch its status.
- When the report is ready to download, open the Actions icon
 and select Download PDF.
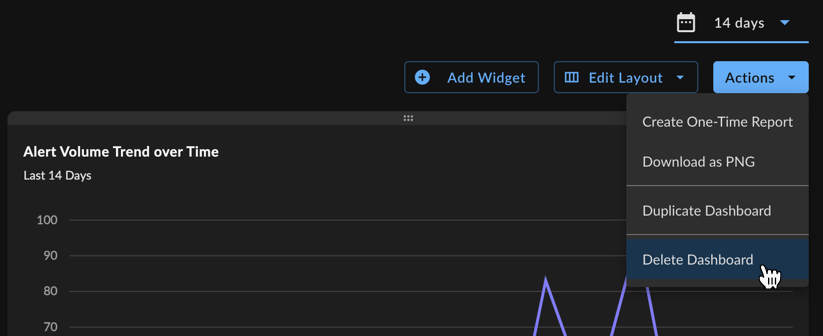
Delete a Custom Dashboard🔗
Note
Users opted in to Preview mode must be a dashboard owner to delete a dashboard.
To delete a custom dashboard:
- Open the dashboard to display it.
- Select More Options > Delete Dashboard.
- Select Delete to confirm.
Export Options🔗
Export Dashboard to PNG🔗
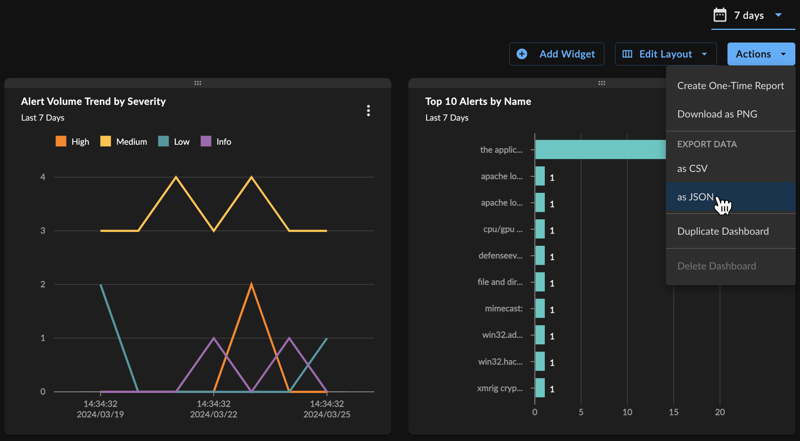
To export the entire dashboard to a PNG image file, select Actions from the top right of the dashboard and choose Download as PNG. The file automatically downloads.
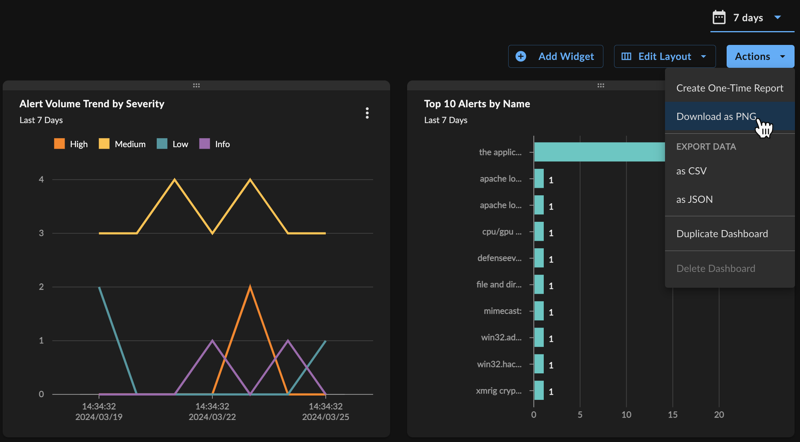
Export Dashboard Data🔗
To export all data from the dashboard to a CSV or JSON file, select Actions from the top right of the dashboard and choose the Export Data CSV or JSON option.
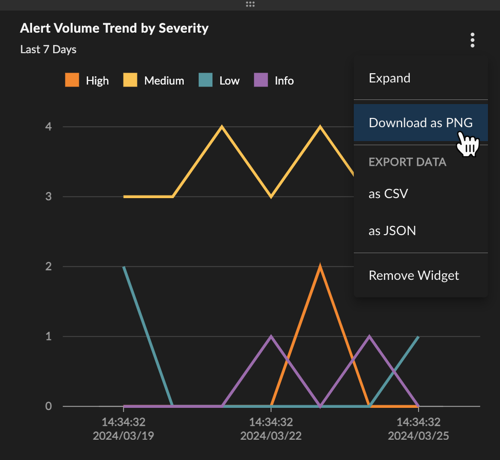
Export Widgets to PNG🔗
To export an individual widget to a PNG image file, select the vertical ellipsis from the top right of the desired widget and choose Download as PNG. The file automatically downloads.
Tip
You can also export the visuals resulting from expanding certain widgets to PNG.
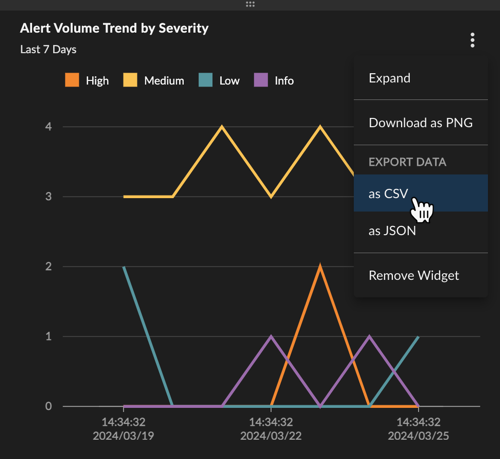
Export Widget Data🔗
To export widget data as a CSV or JSON file, select the vertical ellipsis from the top right of the desired widget and choose the Export Data CSV or JSON option.
Tip
You can also export the data from visuals resulting from expanding certain widgets to CSV or JSON.