Manage Endpoint Agents🔗
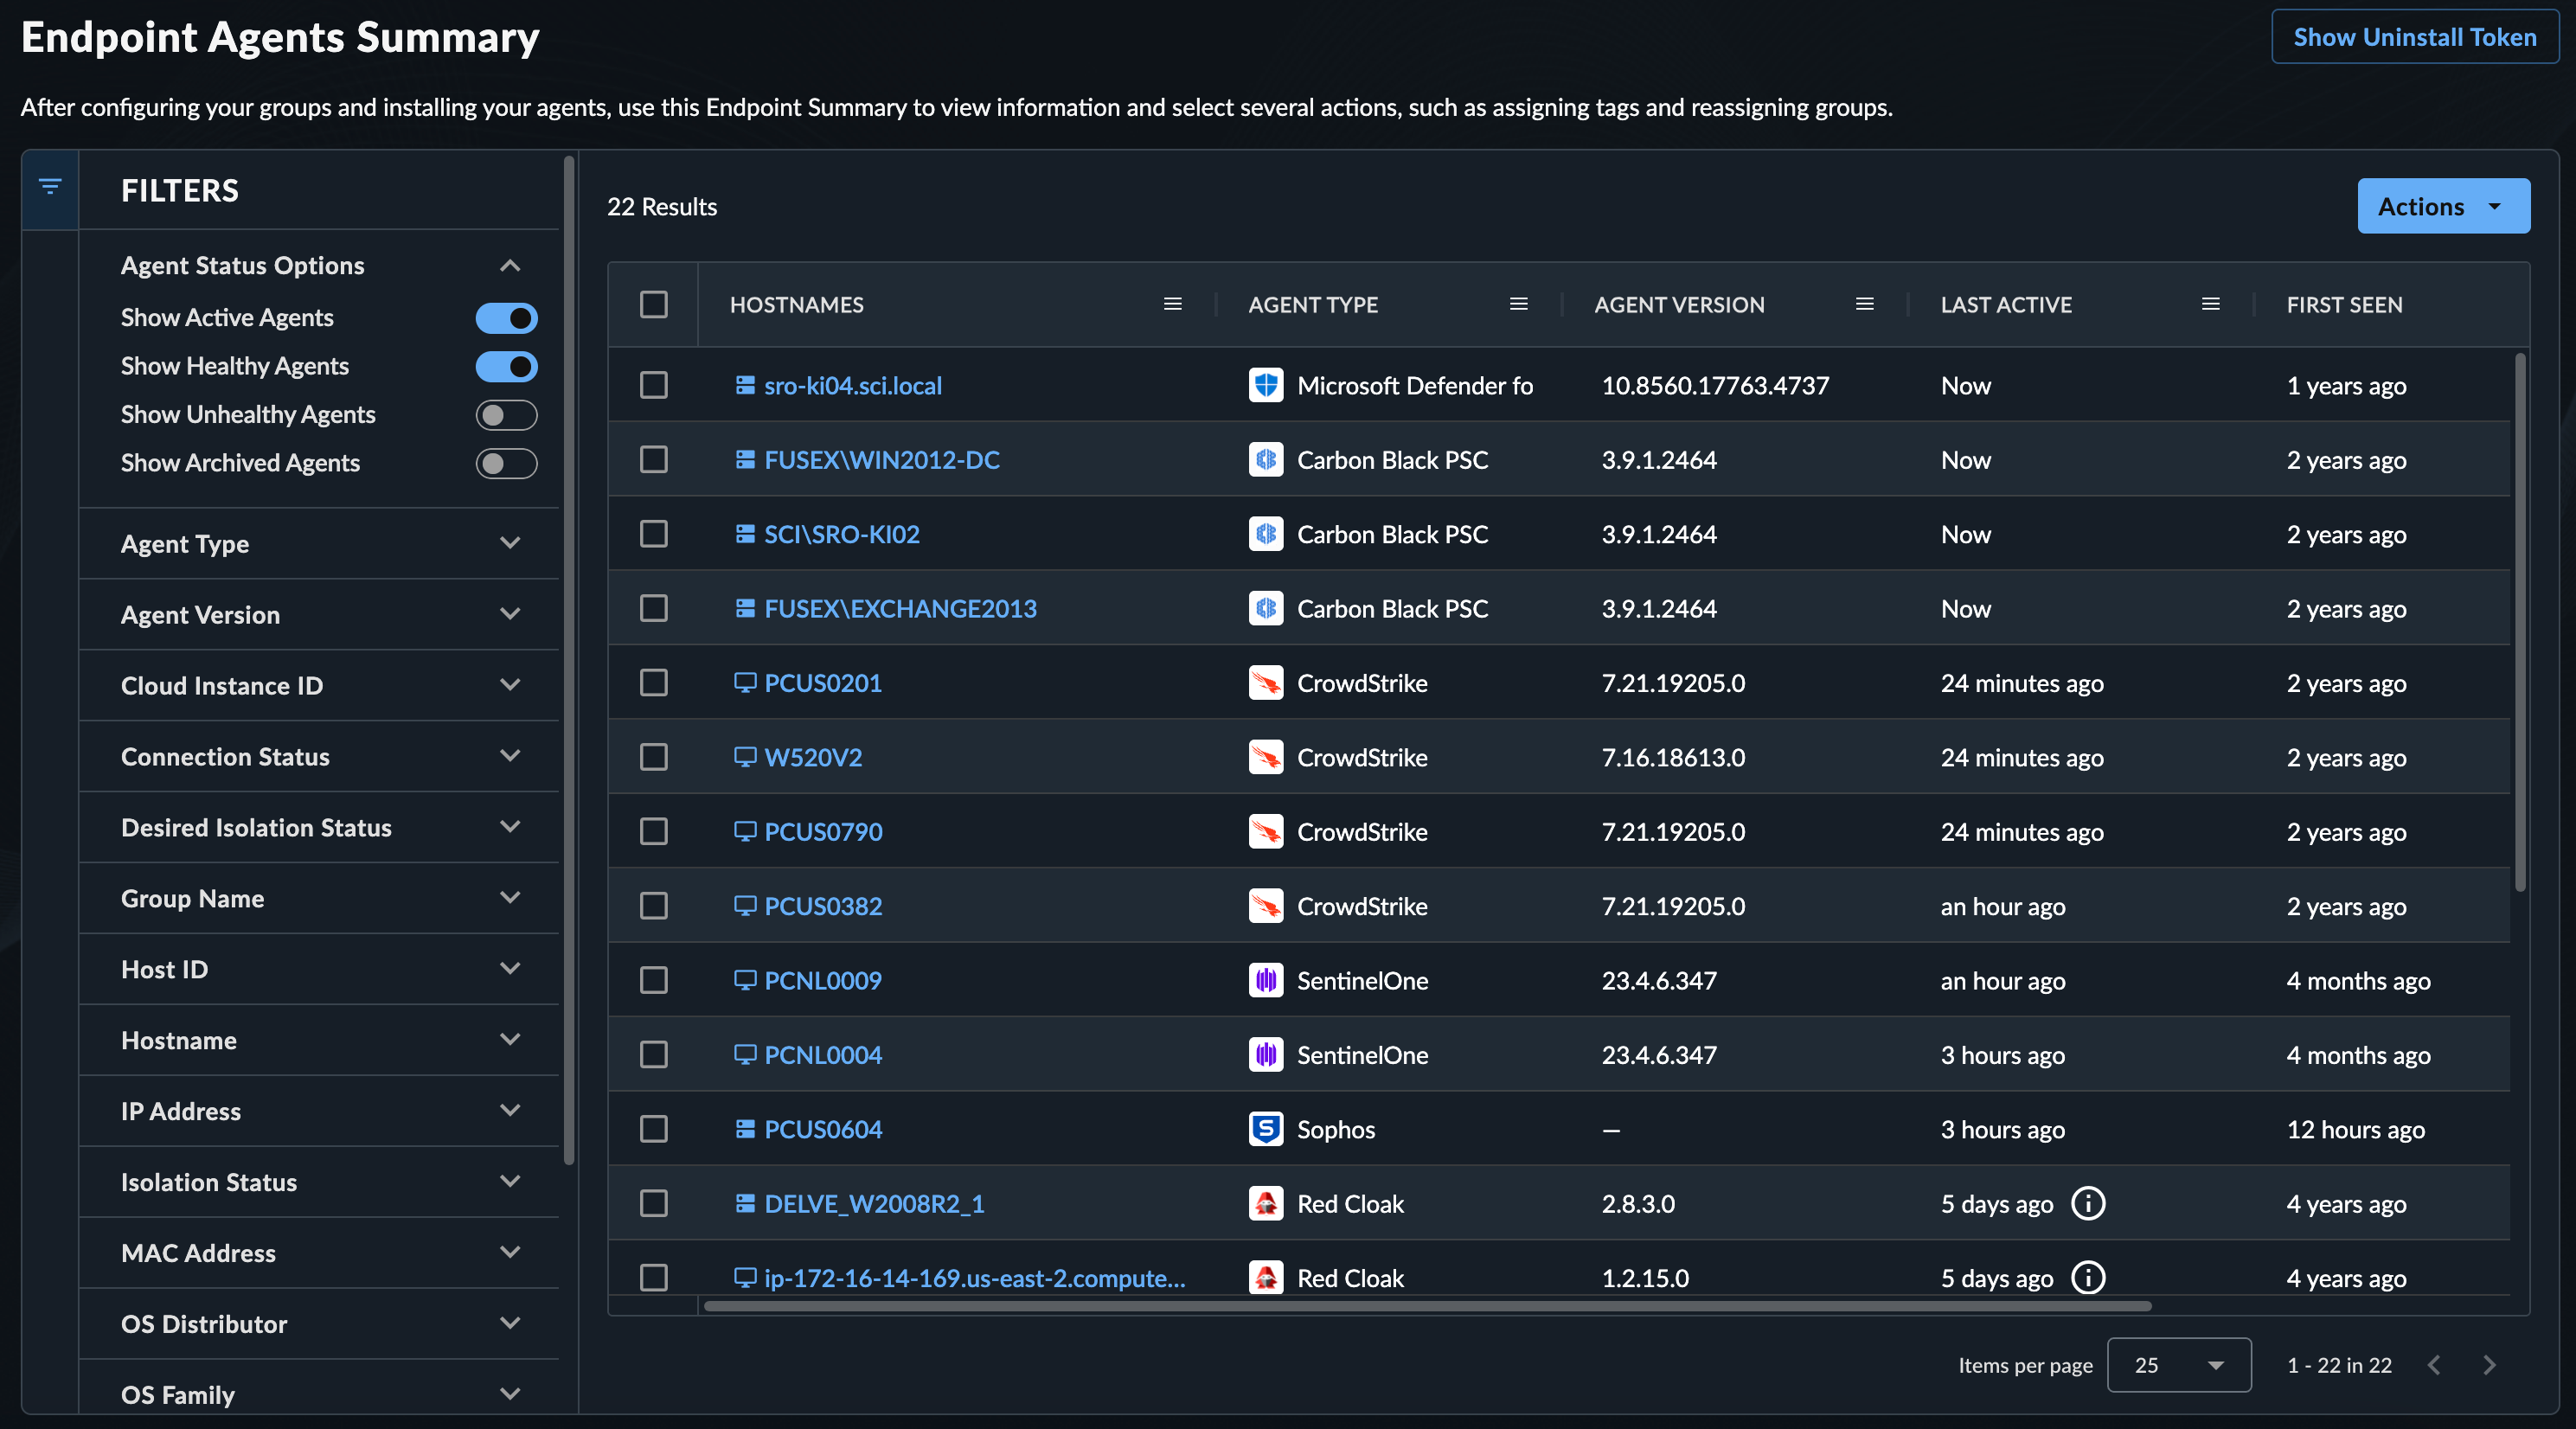
Endpoint Agents Summary allows you to view and manage endpoints with Taegis™ XDR Endpoint Agents, Red Cloak™ Endpoint Agents, and third-party agents that Secureworks® Taegis™ XDR is aware of.
To view:
- From the Taegis Menu, select Endpoint Agents → Summary.
- Endpoint Agents Summary displays a table of endpoints with agents that have been discovered by XDR.
Endpoint Agents Summary Table🔗
The Endpoint Agents Summary table displays quick-view information about each endpoint and its agent.
Use this table to verify the endpoints you installed a supported agent on appear and are sending telemetry, as well as other endpoint details.
Notes
- The
Groupfield applies only to the Taegis Endpoint Agent. - The
Isolation Statuscolumn populates in the table for all supported endpoint agents except Microsoft Defender for Endpoint and EDR OCSF integrations like HarfangLab. - The
Telemetry Receivedfield indicates when data was last received from the endpoint. - The
First Seenfield displays how long ago XDR first received data from the endpoint. - The
Agent Healthfield shows the health status as reported by the vendor. See Agent Details for more information.
The Endpoint Agents Summary table includes the following controls to sort, filter, and arrange data:
Column Menu🔗
Open the menu for available columns in the table by selecting the menu icon to the right of the column name.

Choose one of the following options:
- Pin Column — Pin a column to the left or right of the table
- Autosize This Column — Adjust the size of only the selected column to show obscured information
- Autosize All Columns — Adjust the size of all visible columns to show obscured information
- Reset Columns — Reset all columns to their default size and ordering
Choose Columns to Display🔗
Choose which columns you want to appear in the table by opening a column menu, selecting the columns icon, and checking or unchecking the desired columns.
Use the text box to quickly filter for column names.
Arrange Columns🔗
Drag and drop columns by the header to rearrange them.
Sort by Column🔗
Select a column header to change the sort, when available. There are three toggle states:
- Initial — Default sort
- Ascending — Sorts by the column content in ascending order
- Descending — Sorts by the column content in descending order
You can apply sorting to one column at a time.
Filter Endpoint Agents Summary Table🔗
Use the collapsible filter menu at the left of the table to narrow down the list of matching endpoints.
- As you select filters, the table updates dynamically and the count of results reflects the updated filtered list.
- Selected filters appear above the table; select the X to remove a single filter or Reset to Default to reset the table.

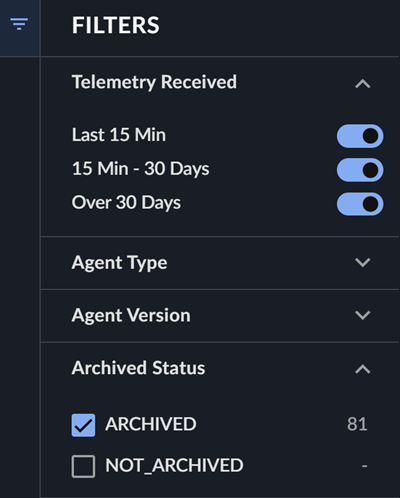
Telemetry Received🔗
Use the Telemetry Received options to filter your view based on when endpoint agents last communicated with XDR. By default, agents seen in the last 30 days are shown.
- Last 15 Min — Endpoint agents that have communicated with XDR within the last 15 minutes
- 15 Min - 30 Days — Endpoint agents that have communicated with XDR between 15 minutes and 30 days ago
- Over 30 Days — Endpoint agents that last communicated with XDR over 30 days ago
Archived Status🔗
To show endpoint agents that have been archived, use the Archived Status filter options. You may need to adjust the Telemetry Received option to include endpoints that have not been seen in Over 30 Days as well.
Filter Values🔗
For filters that include a Filter values field, the string you enter uses the Contains operator by default. Use a wildcard * at the end of your string to perform a Starts With search, or at the start of your string to perform an Ends With search. For example, to search for hostnames that start with desktop, enter desktop* in the Filter values field of the Hostname filter; alternatively, to search for hostnames that end with local, enter *local.

- Enter a text string in the Filter values field to begin filtering the available values.
- Hit Enter to display all results for your string in the table, or select individual results using the checkboxes.
- Delete your string from the field and hit Enter to remove the filter, or select Reset to Default from above the table.
View Vulnerability Status🔗
For XDR tenants that also subscribe to Secureworks® Taegis™ VDR, the Vulnerability Status column displays the rollup vulnerability severity score for endpoints that have been mapped to assets in VDR. To add the Vulnerability Status column to the summary table, see Choose Columns to Display.
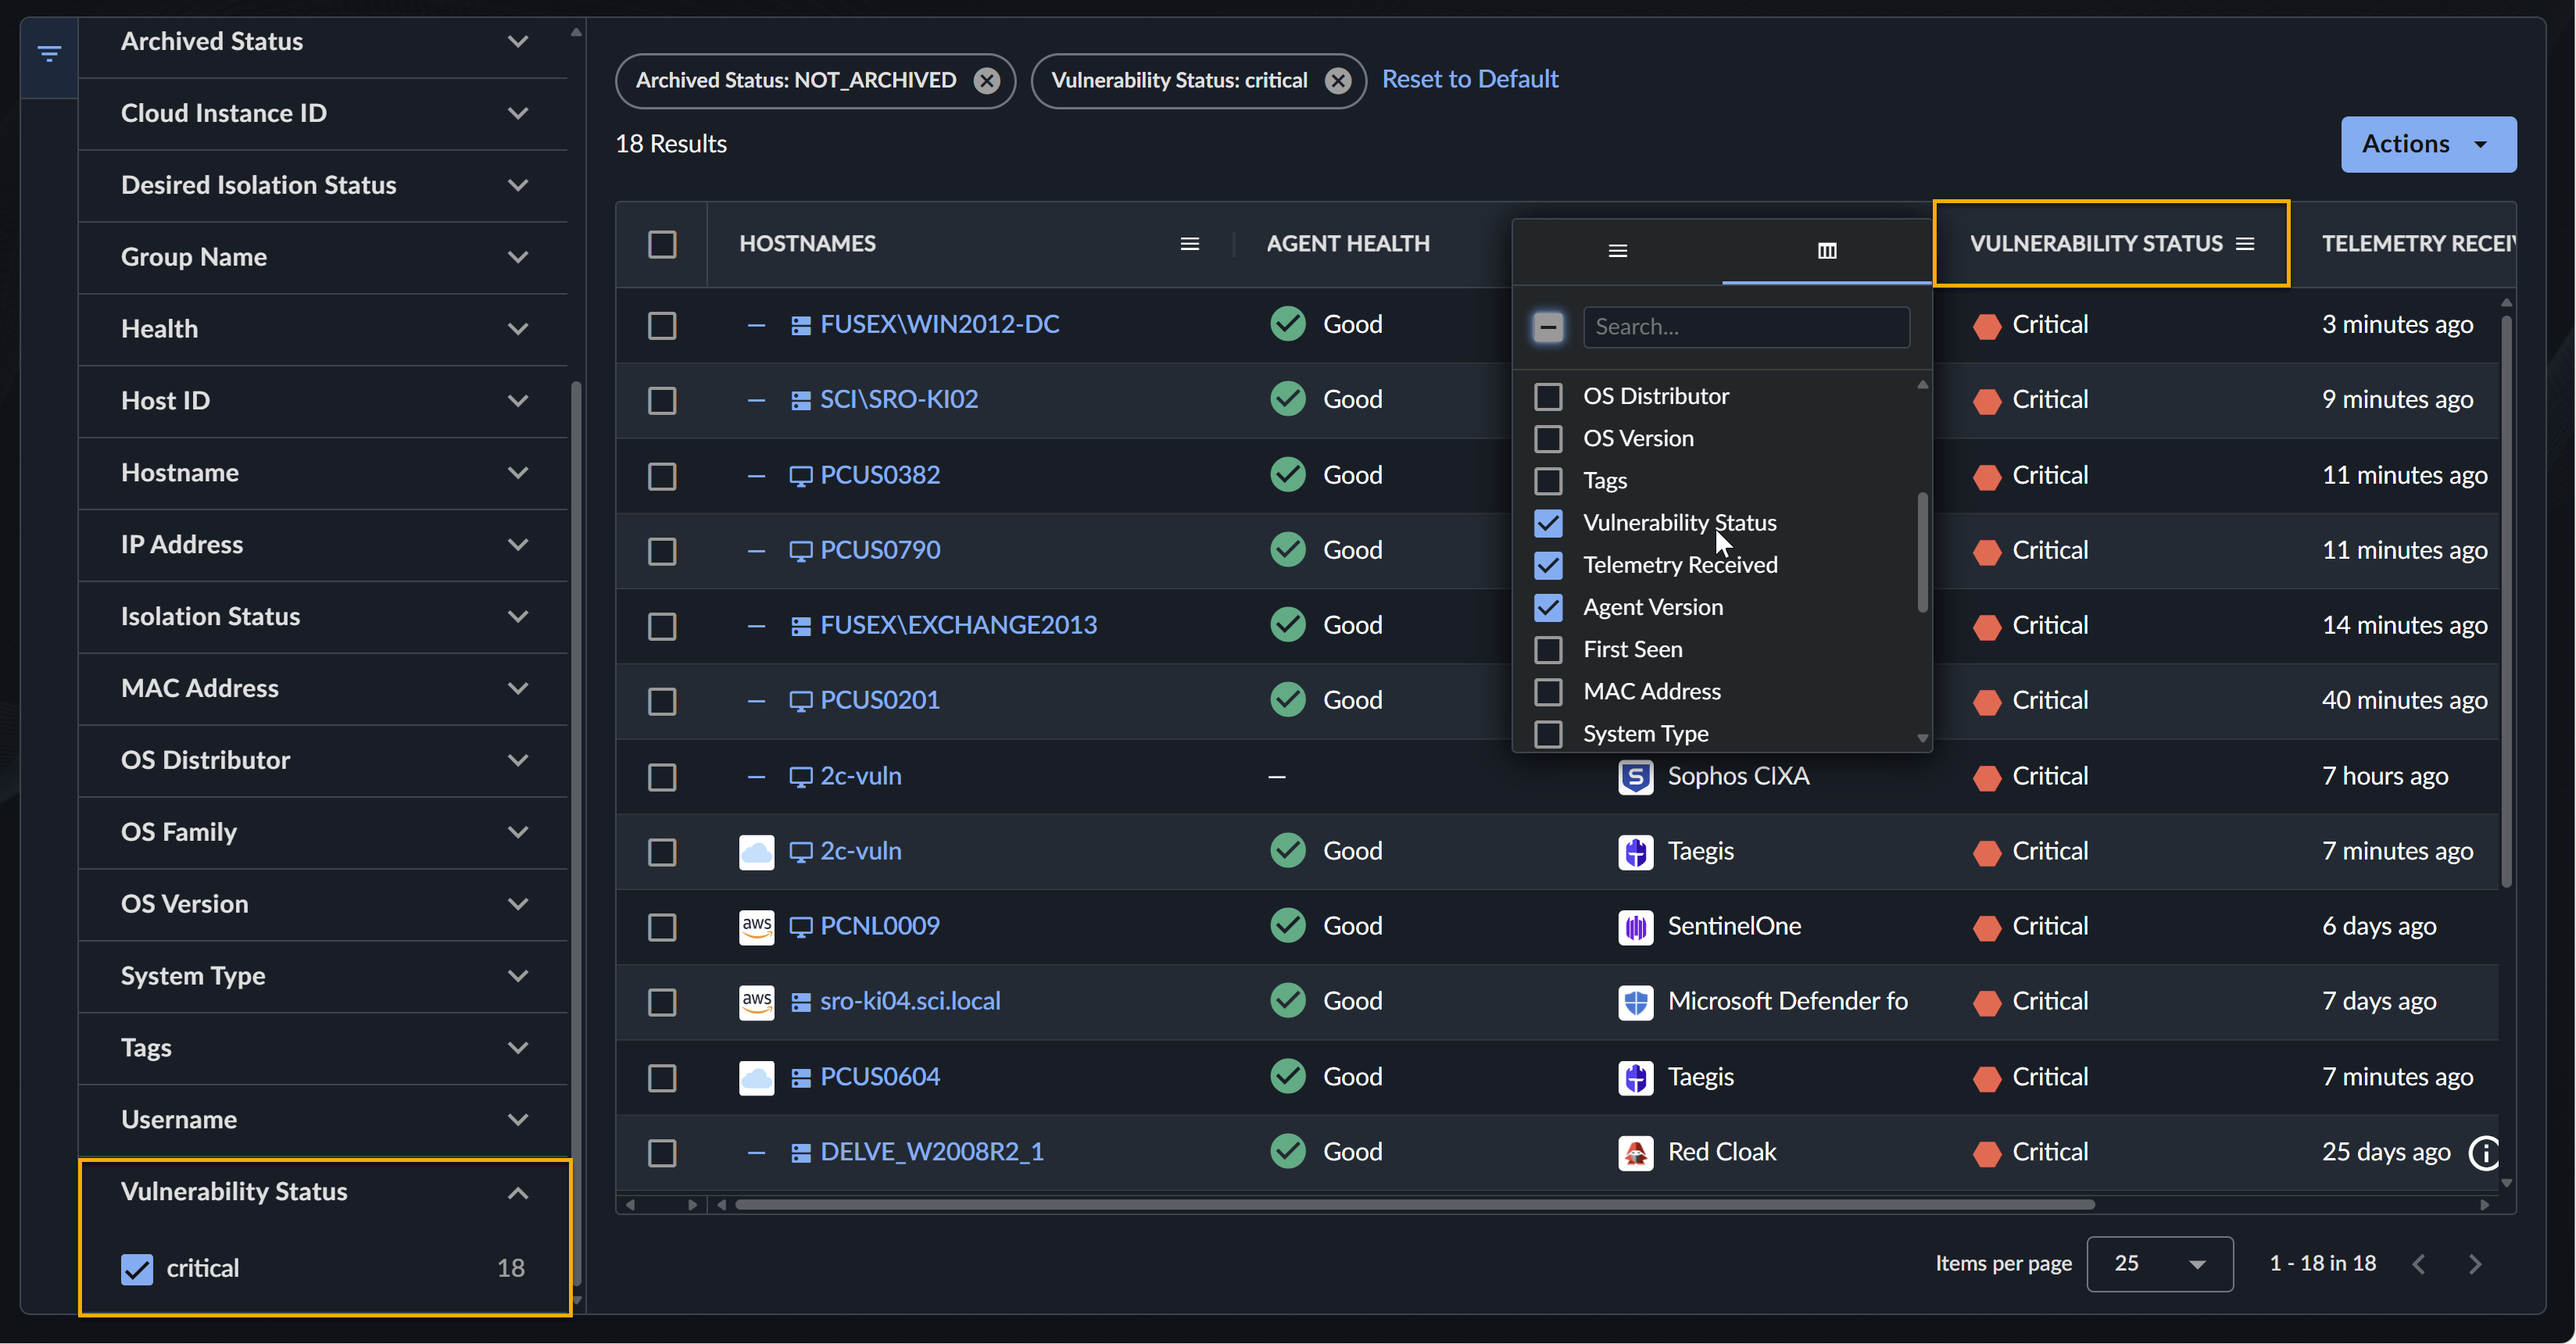
See Vulnerabilities in the endpoint detailed view for a list of vulnerabilities affecting the endpoint.
Identify Cloud Instances 🔗
Identify agents that are deployed as cloud instances with the cloud provider icon that displays before the hostname in the Endpoint Agents Summary table. Endpoints without a cloud identifier record do not have an icon next to the hostname.
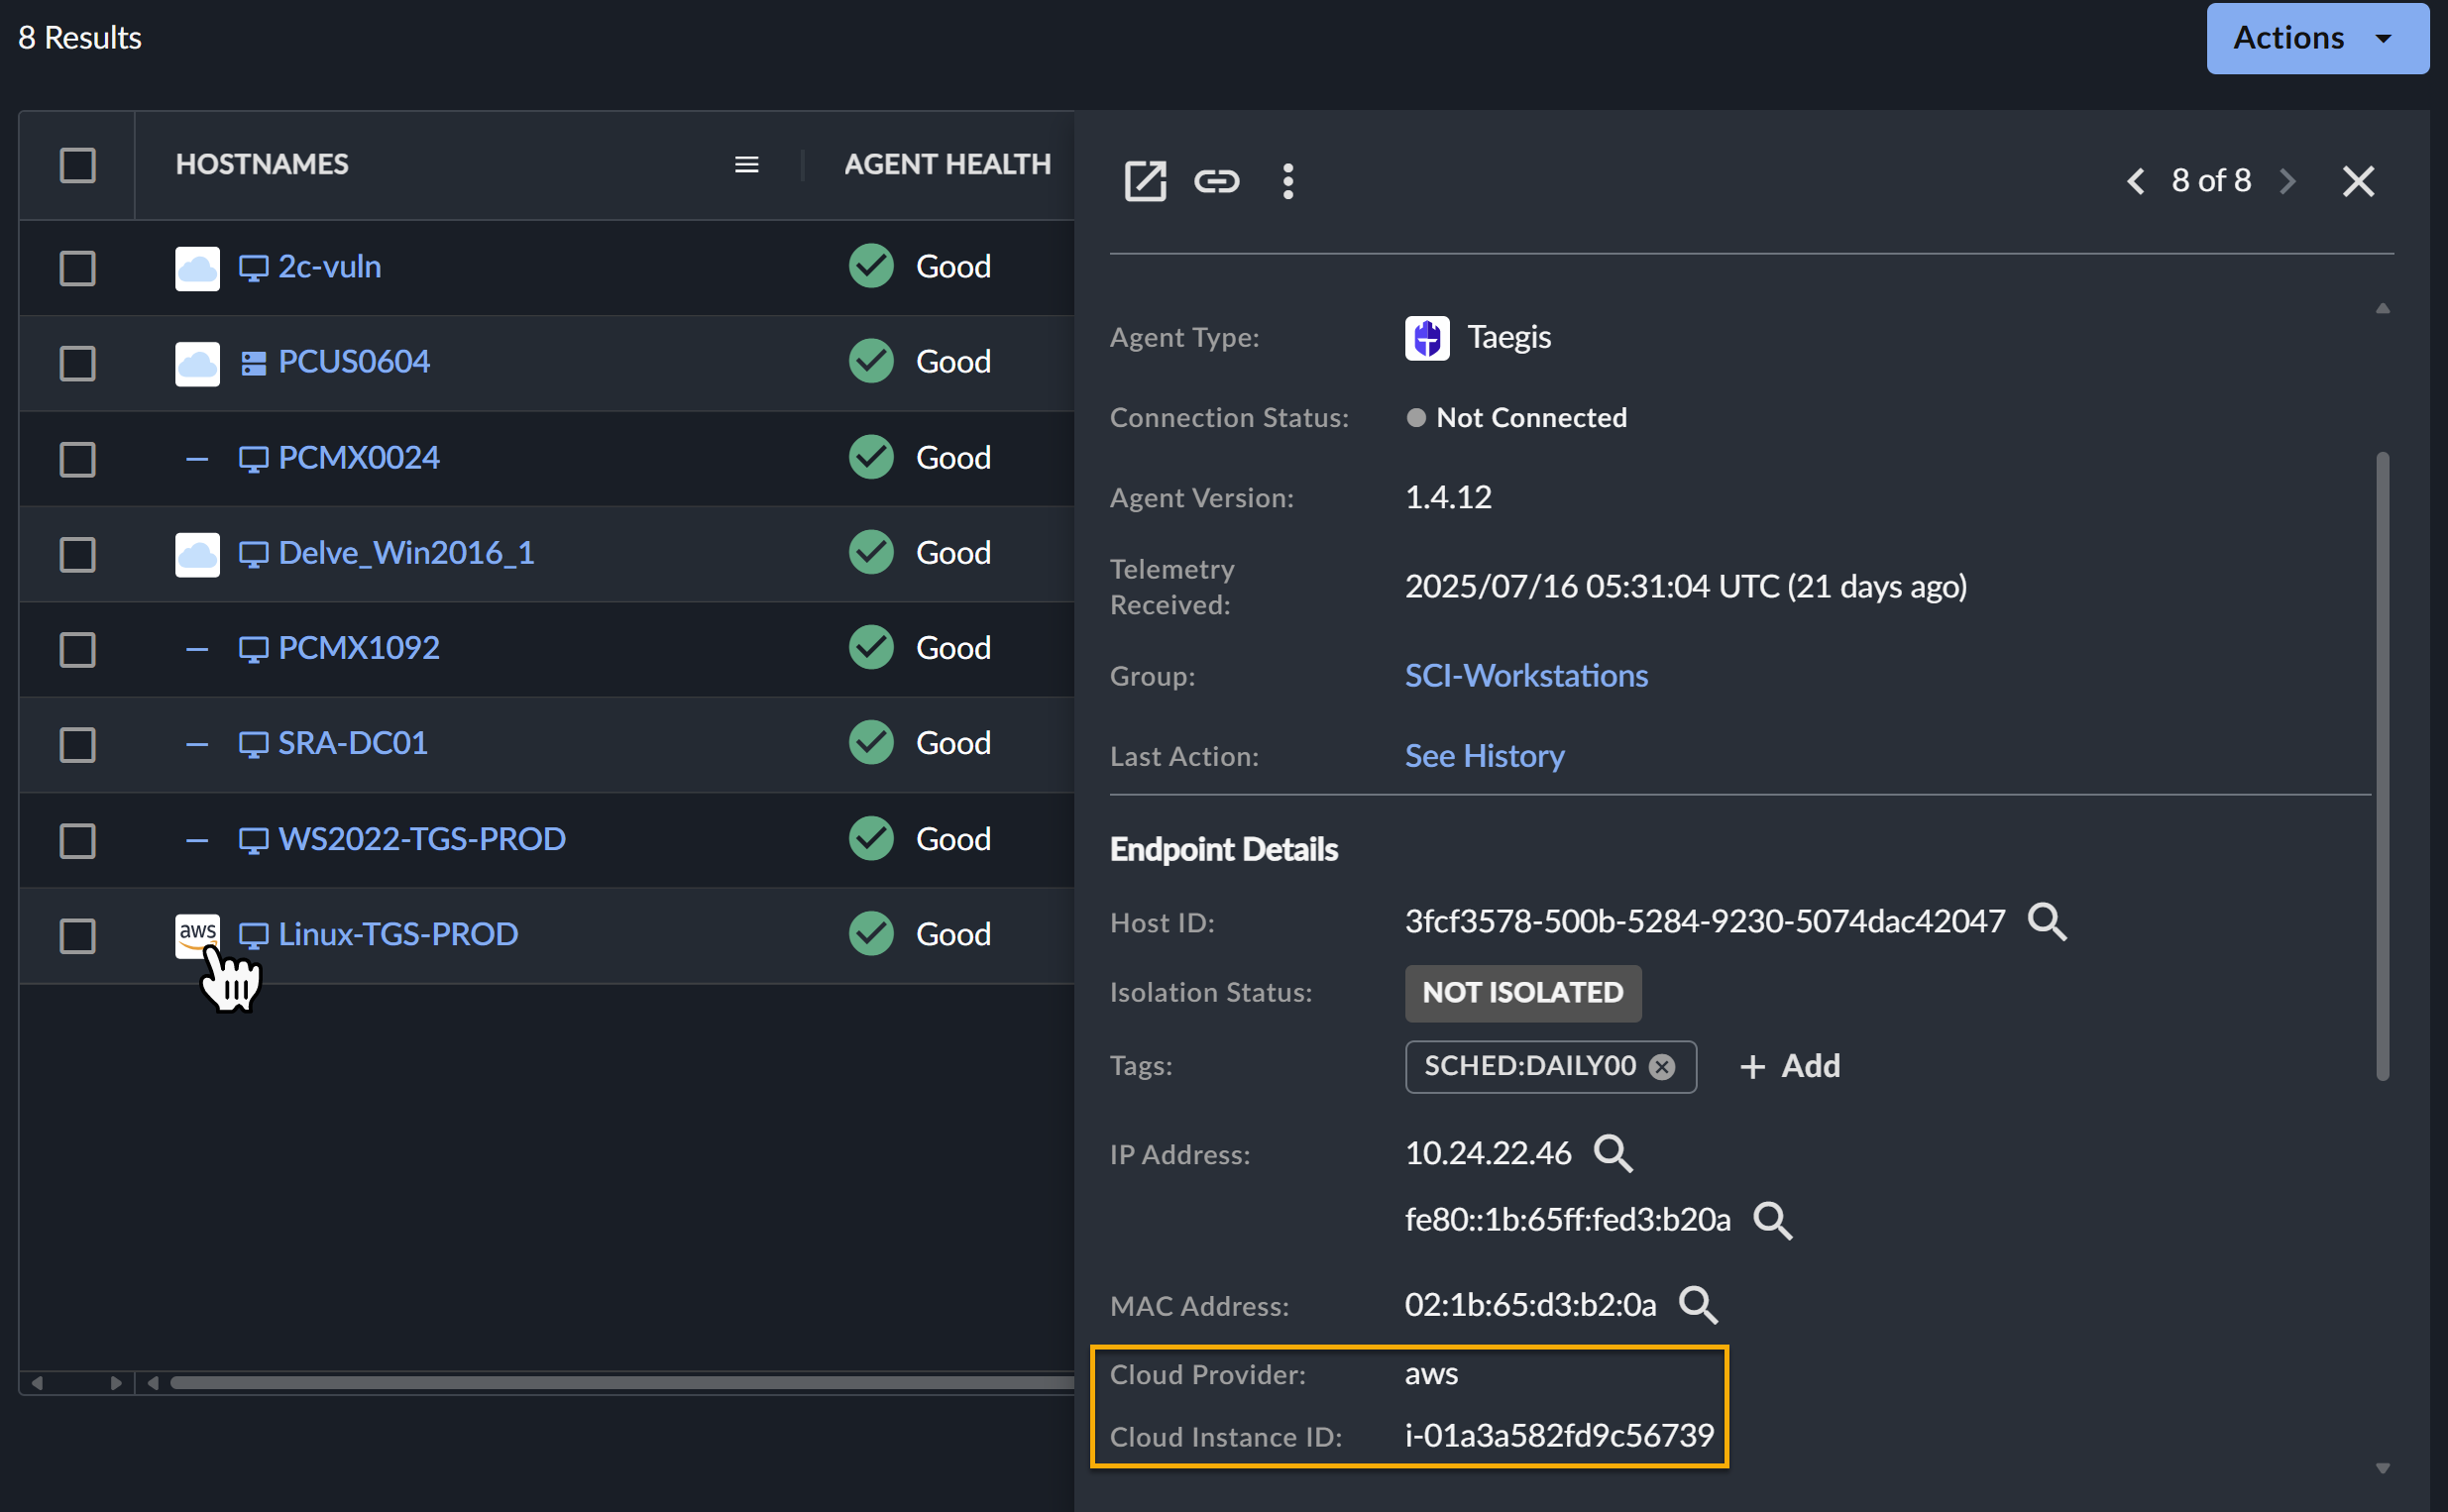
Agent side drawer summary and detailed views also include a cloud provider and cloud instance ID when available.
Select All Endpoints🔗
To select all endpoints resulting from your chosen filters, even if not all results are displayed in the table, follow these steps:
- Filter the Endpoint Agents Summary table as needed.
- Select the checkbox from the top left of the table header row.
- If there are more endpoints resulting from your filters than are currently shown in the table, a message displays above the table with the option to select all results.
- Select the link from the message to Select all Agents in results.
Export Endpoints as CSV File🔗

Export a table of all endpoints or a selected subset of endpoints in CSV format:
- To export all active endpoints included in the table, select the Actions menu from above the table and choose Export All.
- To export a subset of endpoints, select the checkboxes to the left of the endpoints you would like to export, and then select the Actions menu from above the table and choose Export Selected.
View the export status and download the file by selecting Downloads > Data Exports from the Taegis Menu.
Note
The Export All function exports only the active endpoints included in the table by the filters currently selected.
Add and Remove Endpoint Tags🔗
Tags are assigned to endpoints as a key:value pair to add useful context to the endpoint. The key should be a descriptive, constant identifier, while the value is the associated data from the host.
A few examples of key:value pairs are:
Important
You cannot assign two values for the same key on the same endpoint.
Note
key:value pairs are case sensitive. The key must begin with a letter and has a maximum length of 128 characters. The maximum value length is 256 characters. Tags cannot contain spaces, but can contain letters, numbers, and the following symbols: + - = . _ /.
Tags applied to an endpoint appear in the Endpoint Details of both the side drawer summary view and the detailed view.
You can also filter the Endpoint Agents Summary table by tag and add the Tag column to the table. See Filter Endpoints for more information.
Tag a Single Endpoint🔗

-
Assign a tag to a single endpoint in multiple ways:
- From the Endpoint Agents Summary table, select the checkbox for the desired endpoint, and then select the Actions menu from above the table and choose Add Tags. See Bulk Tag Multiple Endpoints to tag multiple endpoints at once.
- From the Endpoint Details of both the side drawer summary view and the detailed view, select + Add from the Tags entry.
-
Enter a tag
keyand avalueassociated with thatkey. For example, entergroupas the key andsalesorproduct_supportas the value. Select + Add Tag to bulk assign more than one tag. -
Select Preview Changes and then Assign Tags when complete.
Bulk Tag Multiple Endpoints🔗
To bulk tag multiple endpoints at once, follow these steps:
-
From the Endpoint Agents Summary table, select the checkboxes for the desired endpoints, and then select the Actions menu from above the table and choose Assign Tags. See Select All Endpoints for guidance on selecting all.
-
Enter a tag
keyand avalueassociated with thatkey. For example, entergroupas the key andsalesorproduct_supportas the value. Select + Add Tag to bulk assign more than one tag. -
Select Preview Changes and then Assign Tags when complete.
Remove a Single Tag🔗
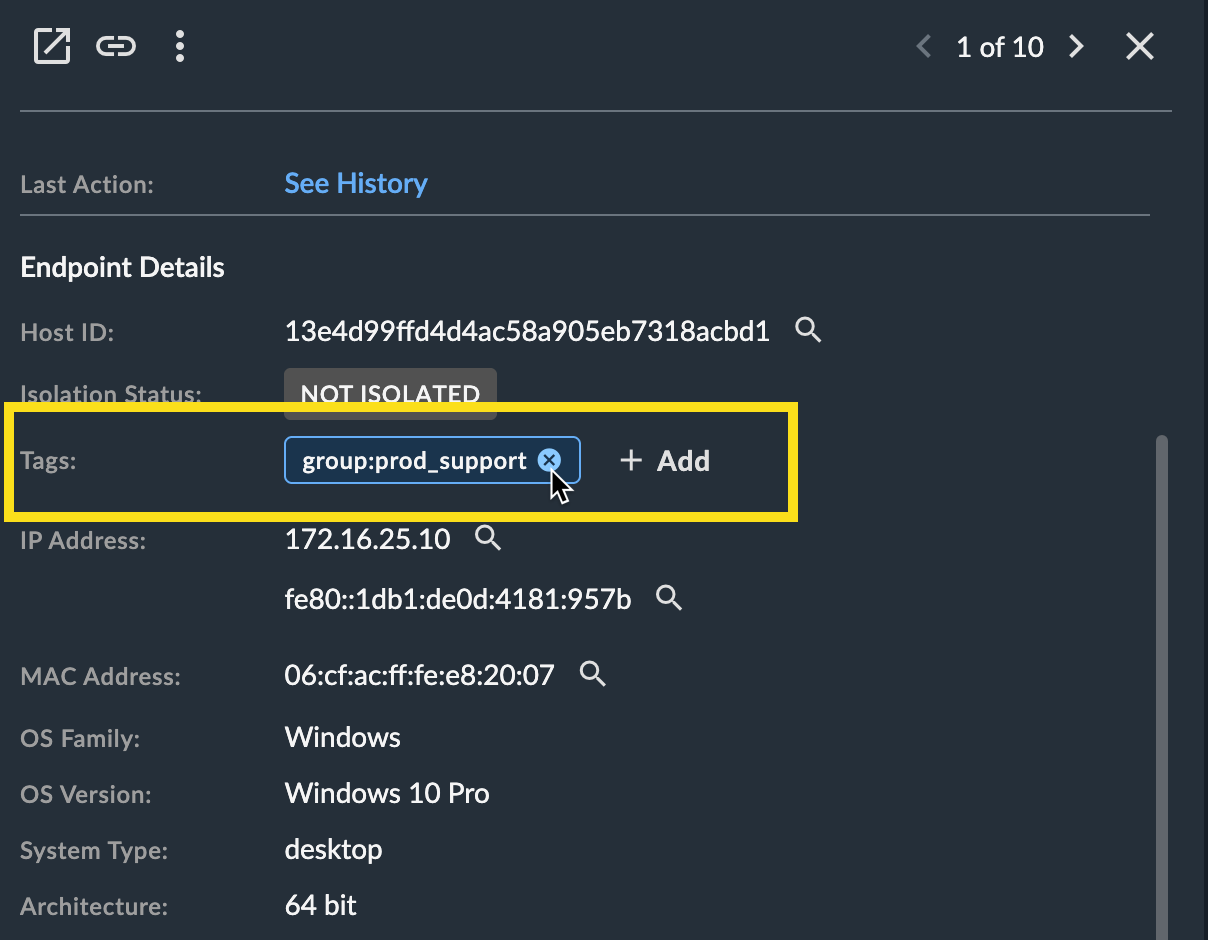
Remove a single tag from an endpoint by selecting the X next to the tag name from the Endpoint Details of both the side drawer summary view and the detailed view.
Bulk Remove Tags from Multiple Endpoints🔗

To bulk remove tags from multiple endpoints at once, follow these steps:
-
From the Endpoint Agents Summary table, select the checkboxes for the desired endpoints, and then select the Actions menu from above the table and choose Remove Tags. See Select All Endpoints for guidance on selecting all.
-
Enter the tag
keyyou would like to remove from the endpoints. For example, for thegroup:prod_supporttag, entergroup. Select + Add Tag Key to bulk remove more than one tag. -
Select Preview Changes and then Remove Tags when complete.
Third-Party Tags🔗
Currently, third-party endpoint tag ingestion is supported for the following integrations:
- VMWare Carbon Black (for tags assigned via a cloud provider)
- CrowdStrike
- Microsoft Defender for Endpoint
- SentinelOne
Please note that vendor-provided endpoint tags cannot be removed in Taegis.
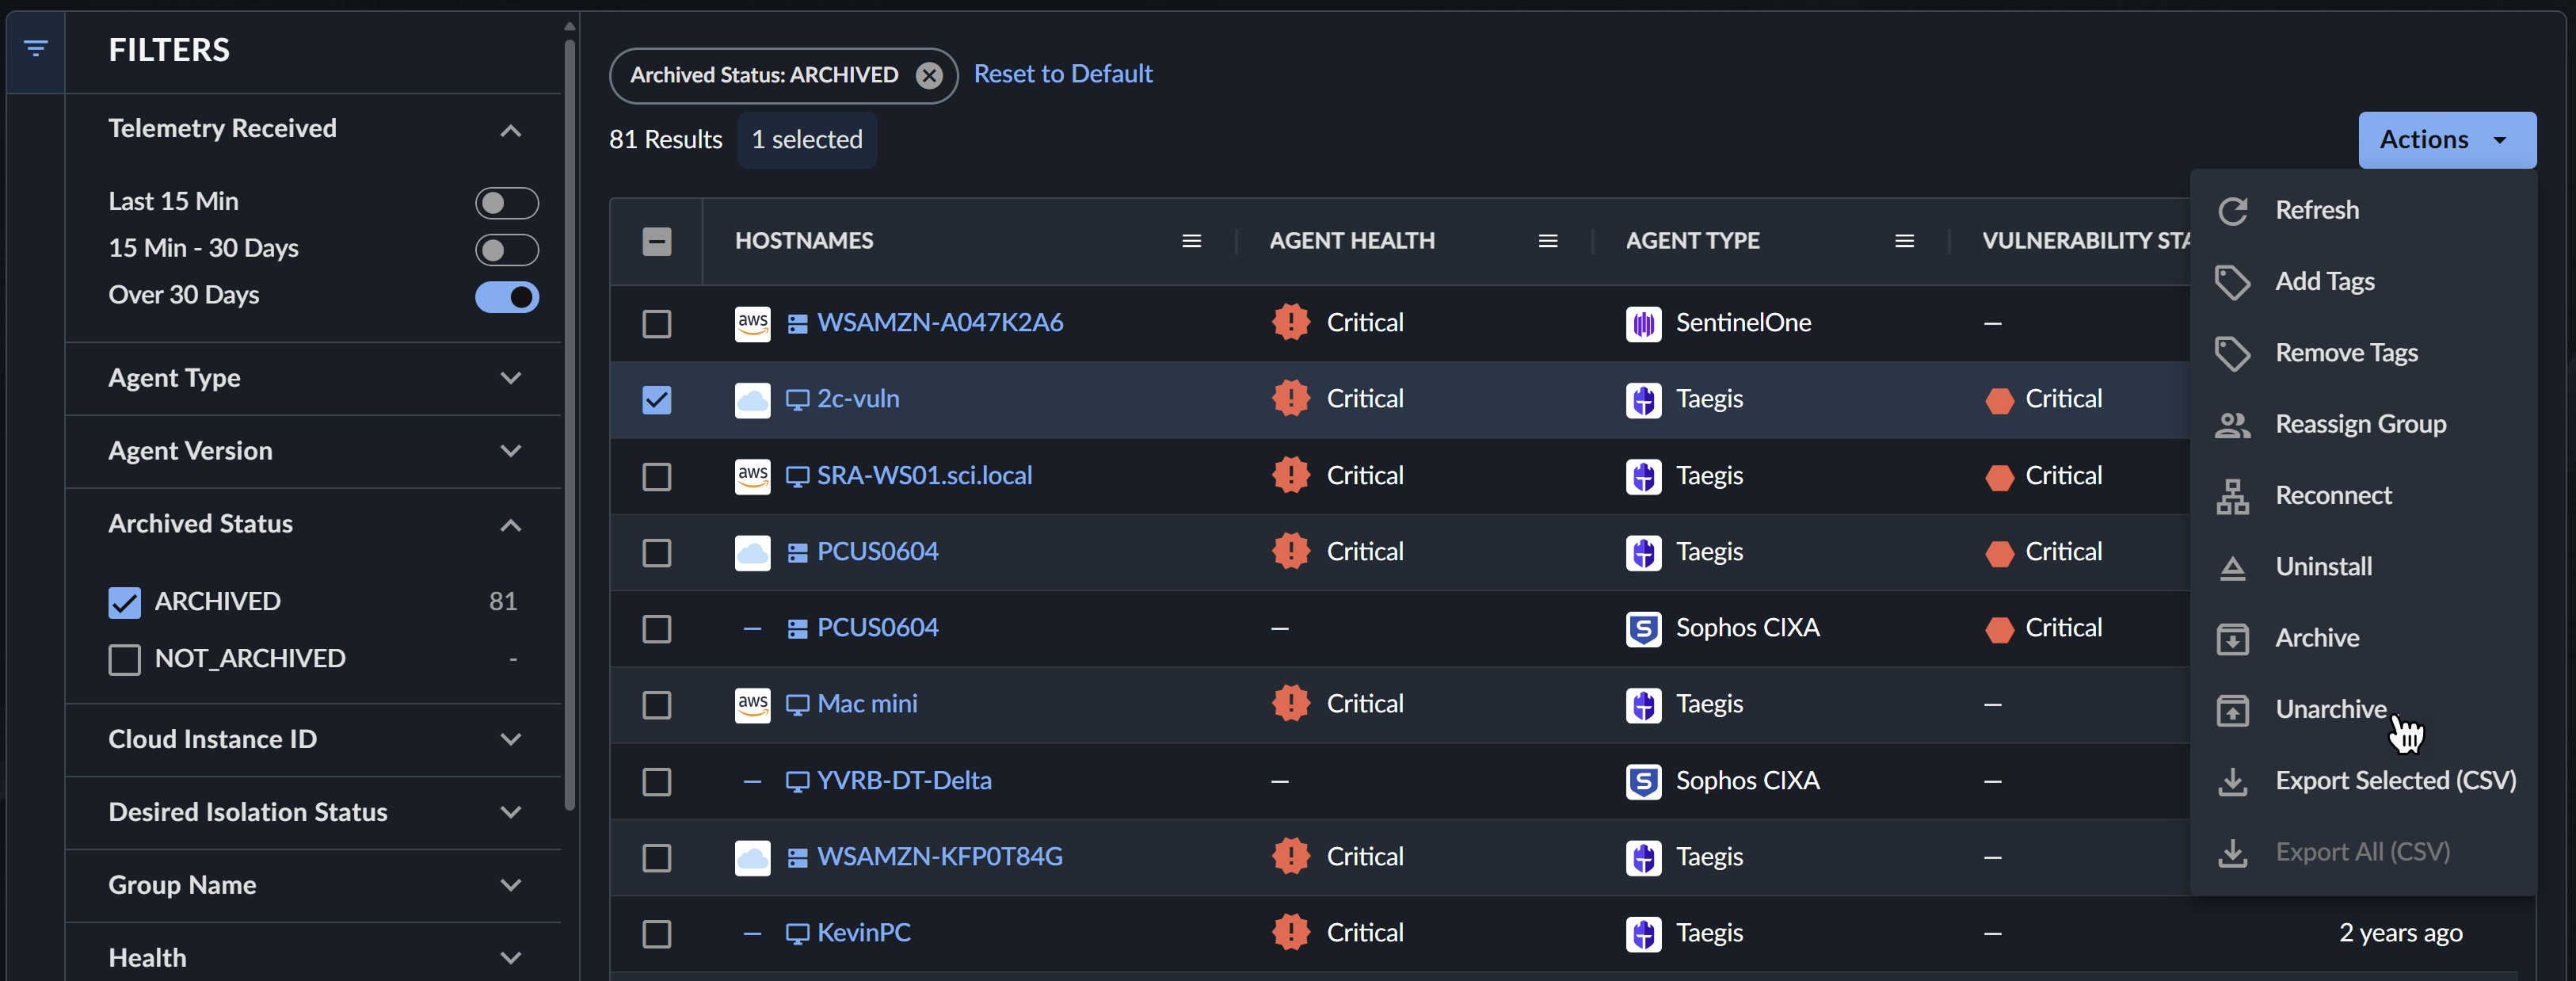
Archive and Unarchive Selected Endpoints🔗
Archive an endpoint to remove it from view if you do not expect that endpoint to report to XDR again. Archiving an endpoint does not affect data ingestion, detections, or telemetry for that endpoint, which remains subject to your data retention policy.
Note
Archived agents that continue to send telemetry to XDR are automatically unarchived. When an agent is initially archived, a brief grace period is provided before unarchiving occurs if the agent continues to send telemetry.
Tip
Taegis Endpoint Agents can be automatically archived after a set time frame using Auto Archive. For more information, see Agent Group Policies.
Archive an Endpoint🔗
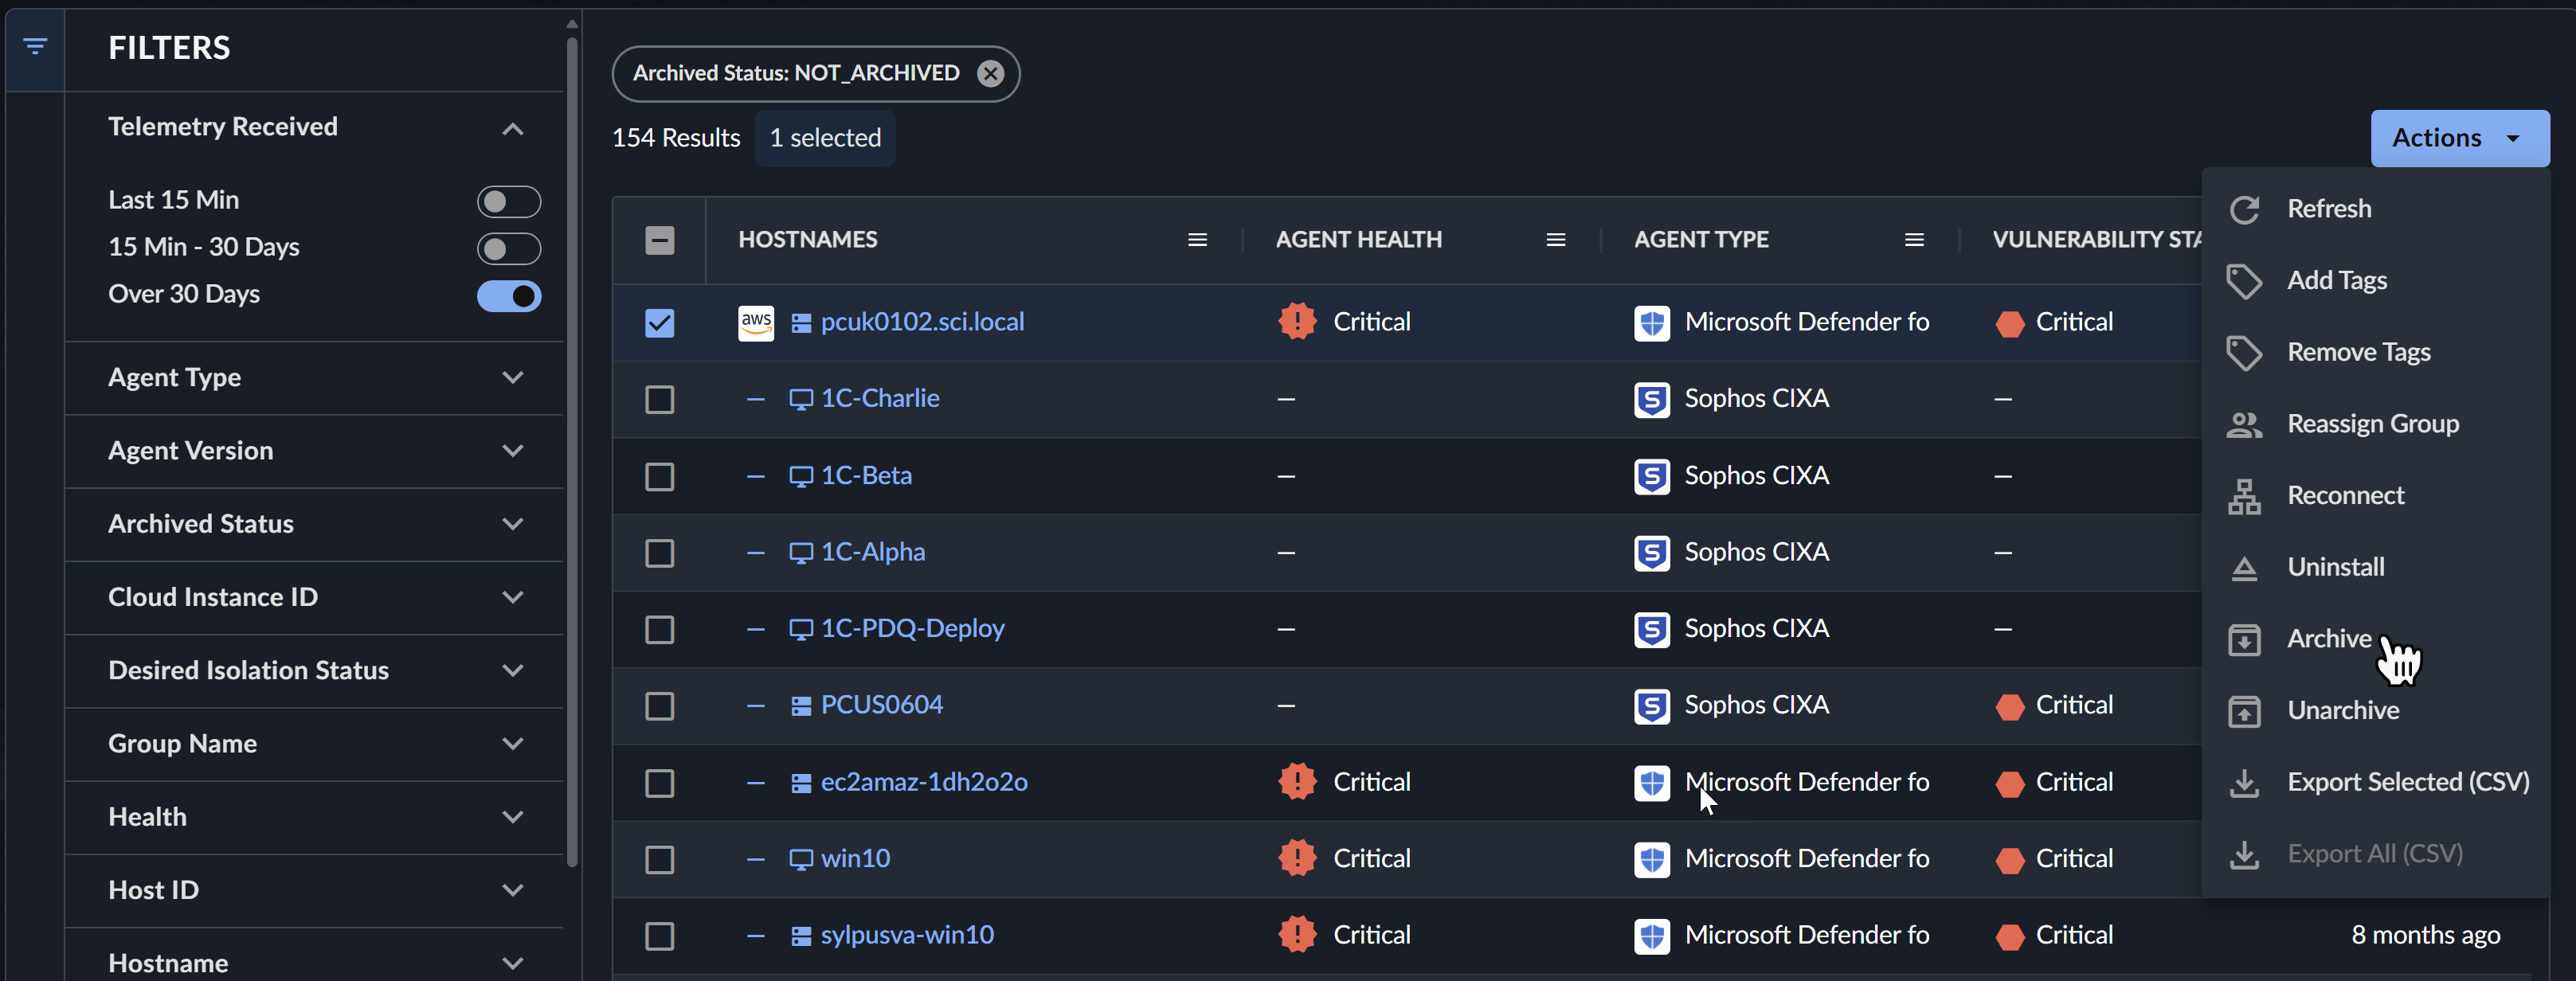
To archive, or hide, endpoints from the Endpoint Agents Summary table, follow these steps:
- Filter the table as needed and then select the checkboxes to the left of the endpoints you want to archive. See Select All Endpoints for guidance on selecting all.
- Select the Actions menu from above the table and choose Archive.
- Upon completion, the selected endpoints are moved to an archived agent status.
Unarchive an Endpoint🔗
To unarchive, or restore, endpoints to the Endpoint Agents Summary table, follow these steps:
- Select the Archived Status filter and select Archived.
- Select the checkboxes to the left of the archived endpoints you want to unarchive. See Select All Endpoints for guidance on selecting all.
- Select the Actions menu from above the table and choose Unarchive.
- Upon completion, the selected endpoints are restored to an active agent status.
View Archived Endpoints🔗
To include archived endpoints in the table, select Archived Status from the filter menu and select Archived. You may need to adjust the Telemetry Received option to include endpoints that have not been seen in Over 30 Days as well.
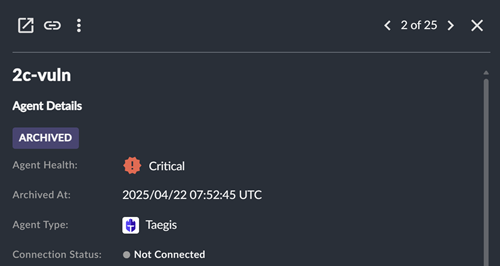
Archived endpoints display a label in the Agent Details in the side drawer summary view and the detailed view:
Reassign Taegis Agent Group🔗
Note
Group functionality is available only for the Taegis Endpoint Agent. See Agent Groups for more information.

To reassign one or more Taegis Endpoint Agents to a new Group, follow these steps:
- Filter the table by Group if needed and then select the checkboxes to the left of the endpoints you would like to reassign. See Select All Endpoints for guidance on selecting all.
- Select the Actions menu from above the table and choose Reassign Group.
- Select the Group you would like to reassign the selected endpoints to from the drop-down menu and then select Reassign.
Reconnect Taegis Agents🔗
Note
The Reconnect Agents action is available only for Taegis Endpoint Agents that are both Active and Connected.

Use the Reconnect Agents action to connect one or more Active and Connected Taegis Endpoint Agents to the registration server to initiate an auto-update if a new Taegis Endpoint Agent version is available. To reconnect agents, follow these steps:
- Select the checkboxes to the left of the Taegis Endpoint Agents you would like to reconnect. See Select All Endpoints for guidance on selecting all.
- Select the Actions menu from above the table and choose Reconnect.
- Enter a reason for the action in the dialog and select Reconnect.
Note
You can also reconnect an individual Taegis Agent from the Actions menu of the endpoint side drawer summary view or detailed view.
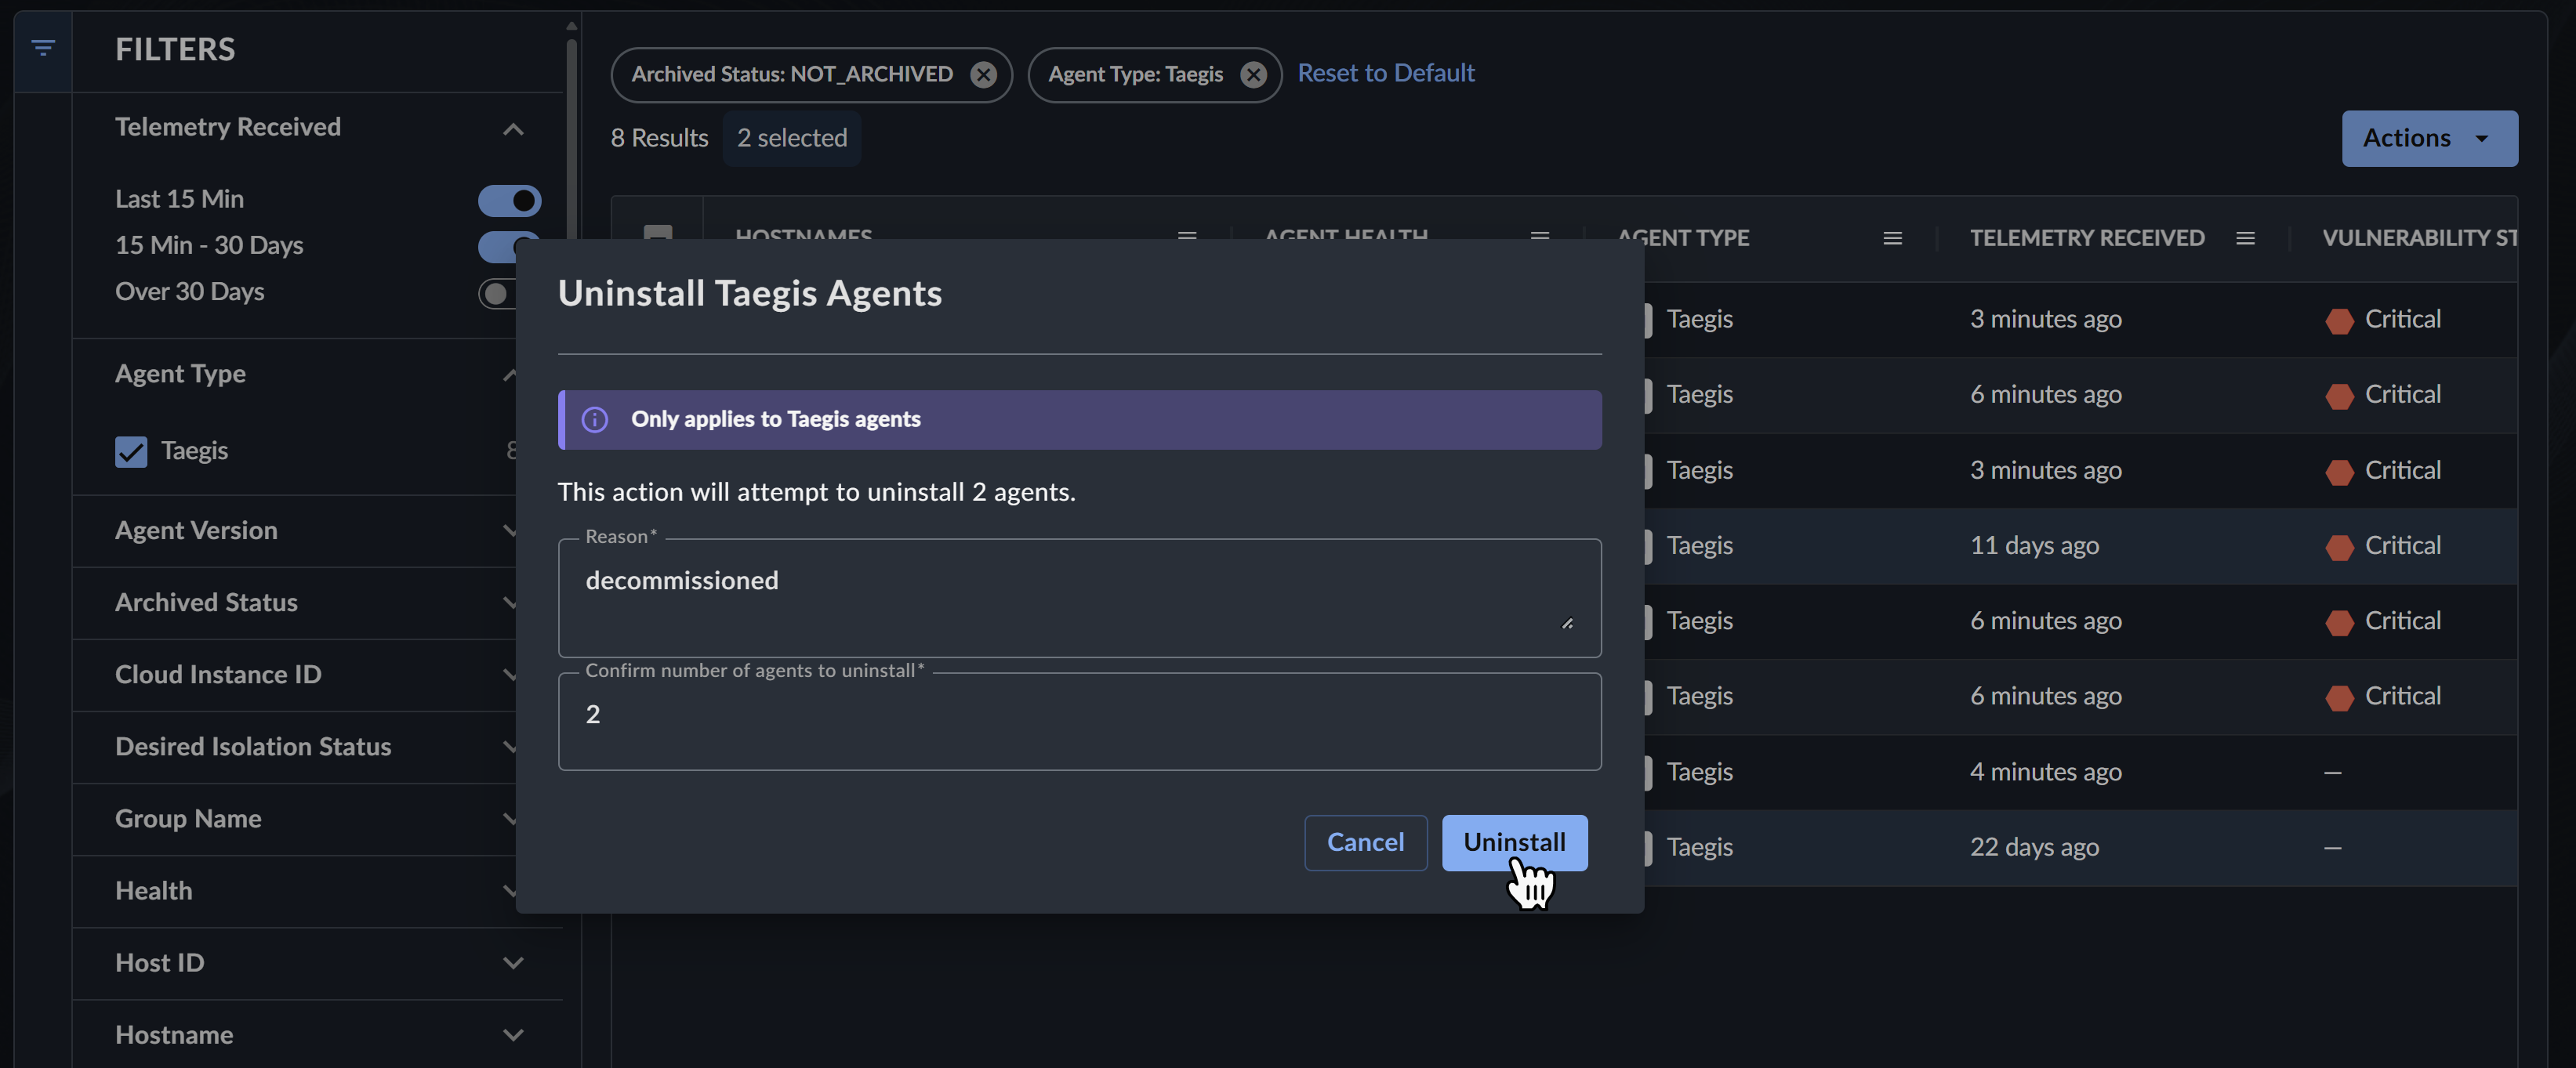
Uninstall Taegis Agents🔗
Note
The Uninstall Agents action is available only for supported Taegis Endpoint Agents that are both Active and Connected. Uninstall Agents is supported by all Windows and Linux versions and macOS version 2.0.9 and later. For other uninstall options, see Taegis Endpoint Agent Uninstall.
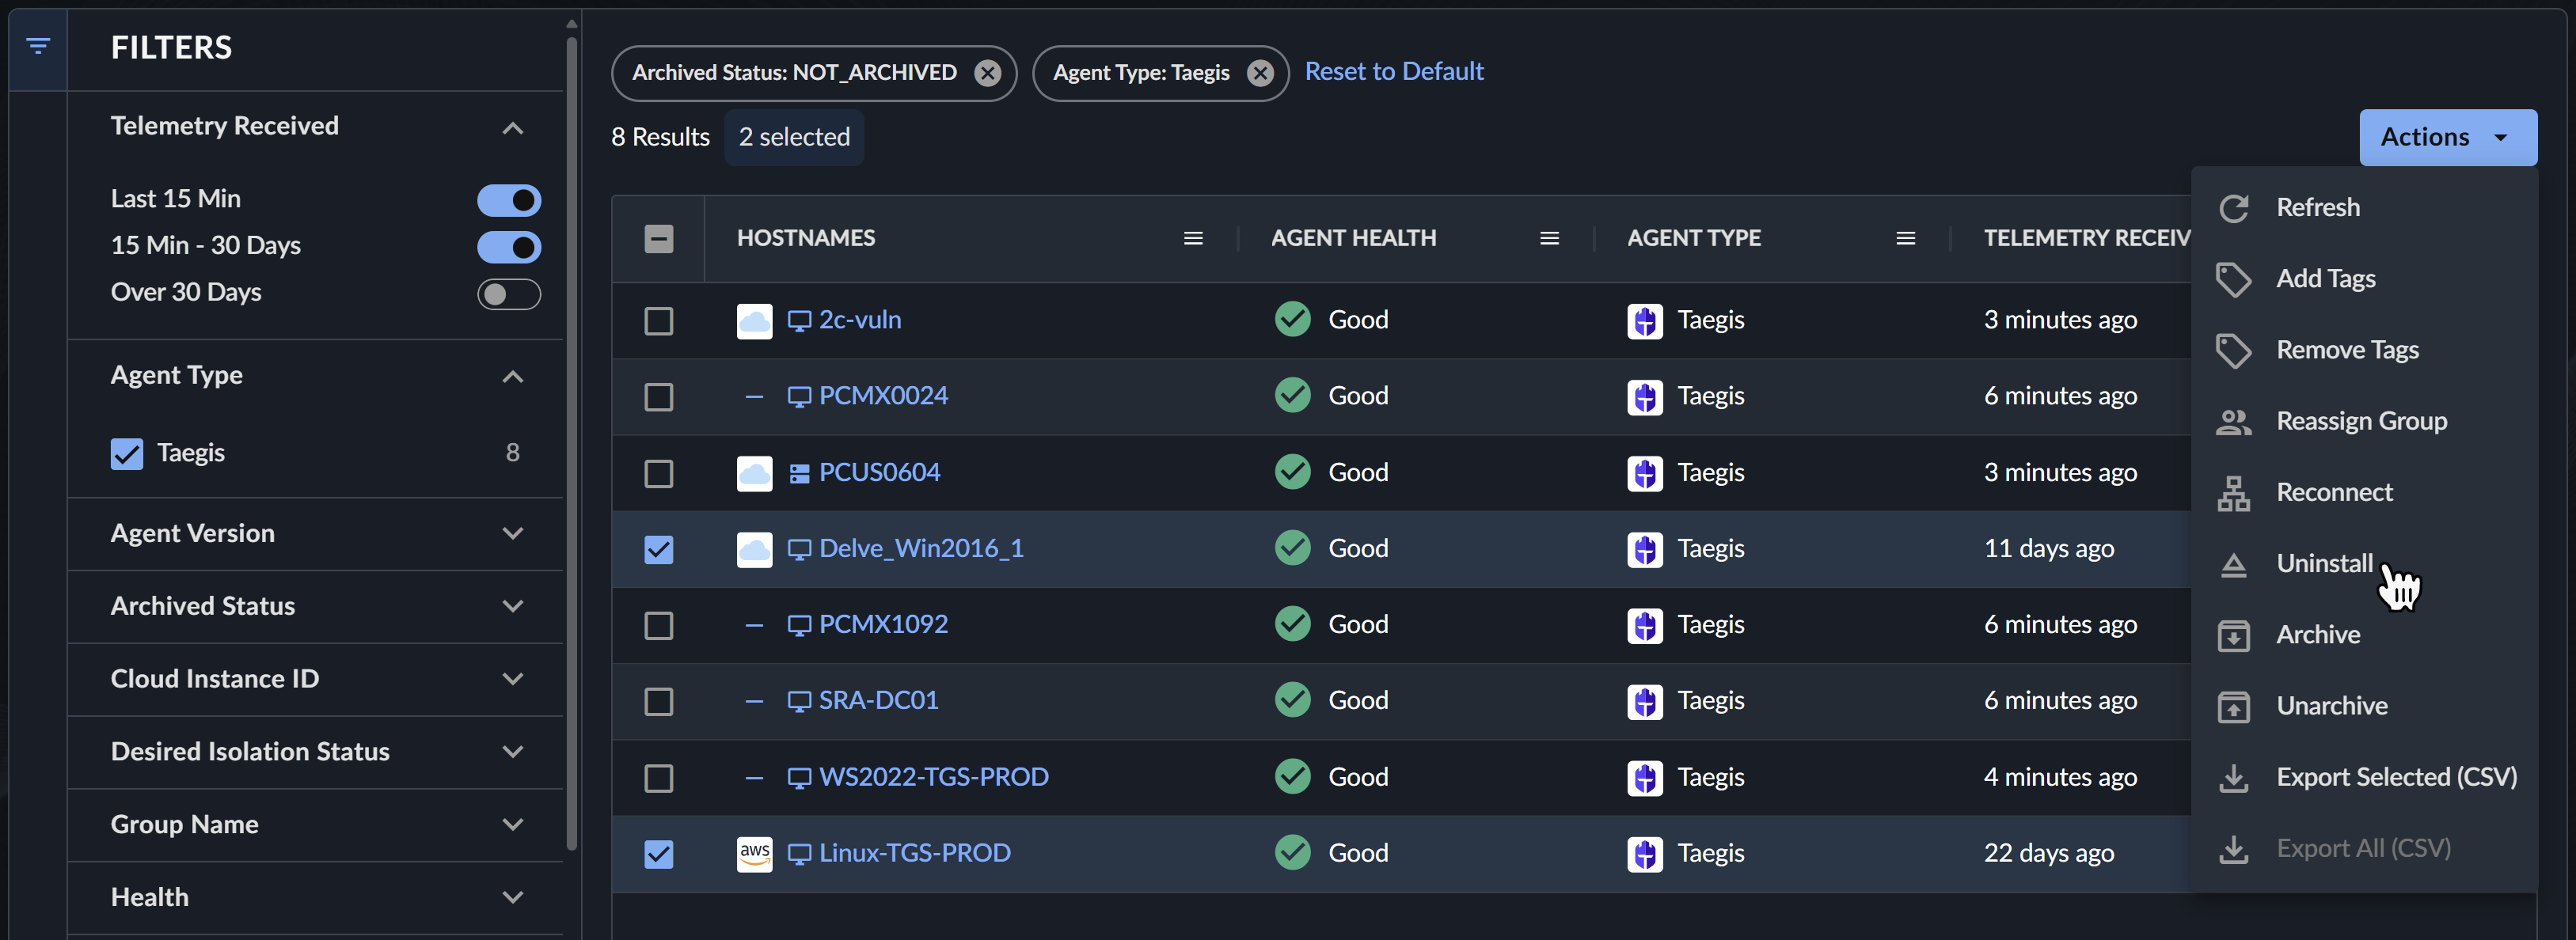
Use the Uninstall action to uninstall one or more Taegis Endpoint Agents from Active and Connected endpoints. Follow these steps:
- Select the checkboxes to the left of the Taegis Endpoint Agents you would like to uninstall. See Select All Endpoints for guidance on selecting all.
- Select the Actions menu from above the table and choose Uninstall. The Uninstall Taegis Agents form displays with the amount of agents that will be uninstalled
- Enter a reason for the action.
- Enter the number of agents being uninstalled in numerical digits as displayed at the top of the form to confirm the bulk action is intentional.
- Select Uninstall.
Important
The Uninstall button only becomes active after you enter both a reason and the number of agents being uninstalled.
Note
You can also uninstall an individual Taegis Agent from the Actions menu of the endpoint side drawer summary view or detailed view.
Tip
A Pending Uninstall badge displays in Agent Details when the Uninstall action is taken for Taegis Endpoint Agents.
Generate Tamper Protection Uninstall Token🔗
If Tamper Protection is enabled in your Taegis Endpoint Agent group policy, generate an uninstall token for use when uninstalling the agent outside of the XDR UI.
Important
Tokens expire one hour after they are generated.
Tenant-Wide Uninstall Token🔗
Access the tenant-wide uninstall token by selecting Show Uninstall Token from above the Endpoint Agents Summary table.
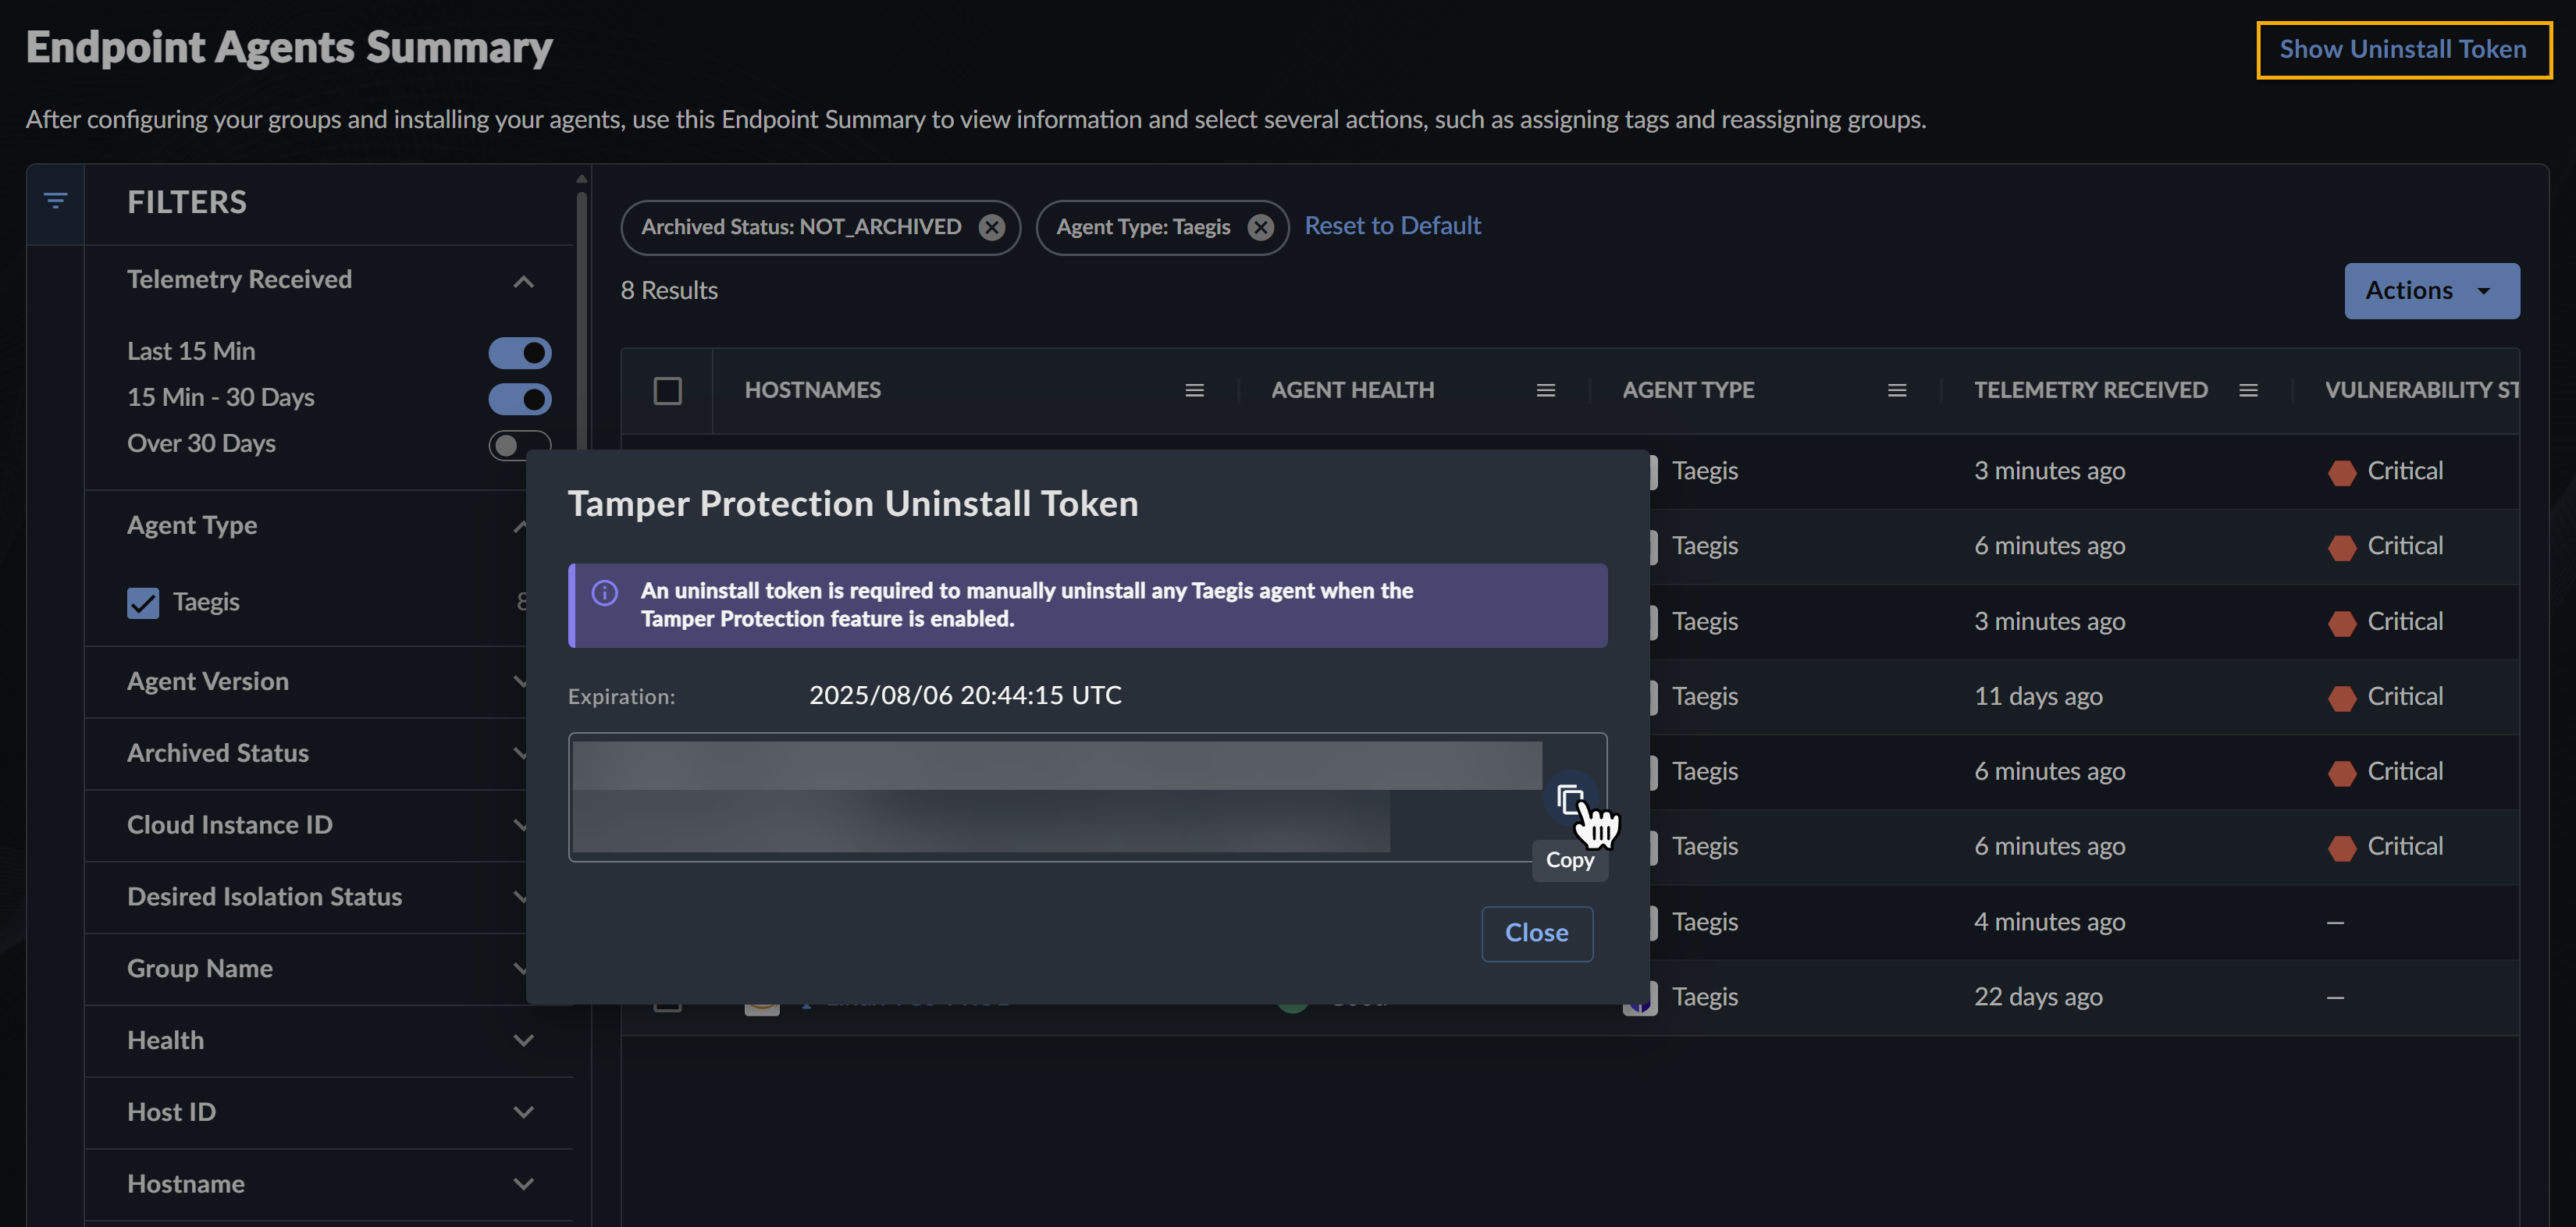
Host-Specific Uninstall Token🔗
Restrict the uninstall token to a specific endpoint by selecting Generate Uninstall Token from the actions menu of the desired endpoint.
Note
The Generate Uninstall Token action is unavailable if the endpoint does not belong to a group with an assigned policy with Tamper Protection enabled.
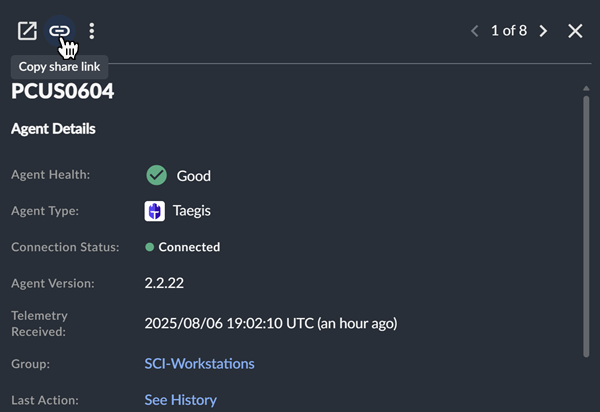
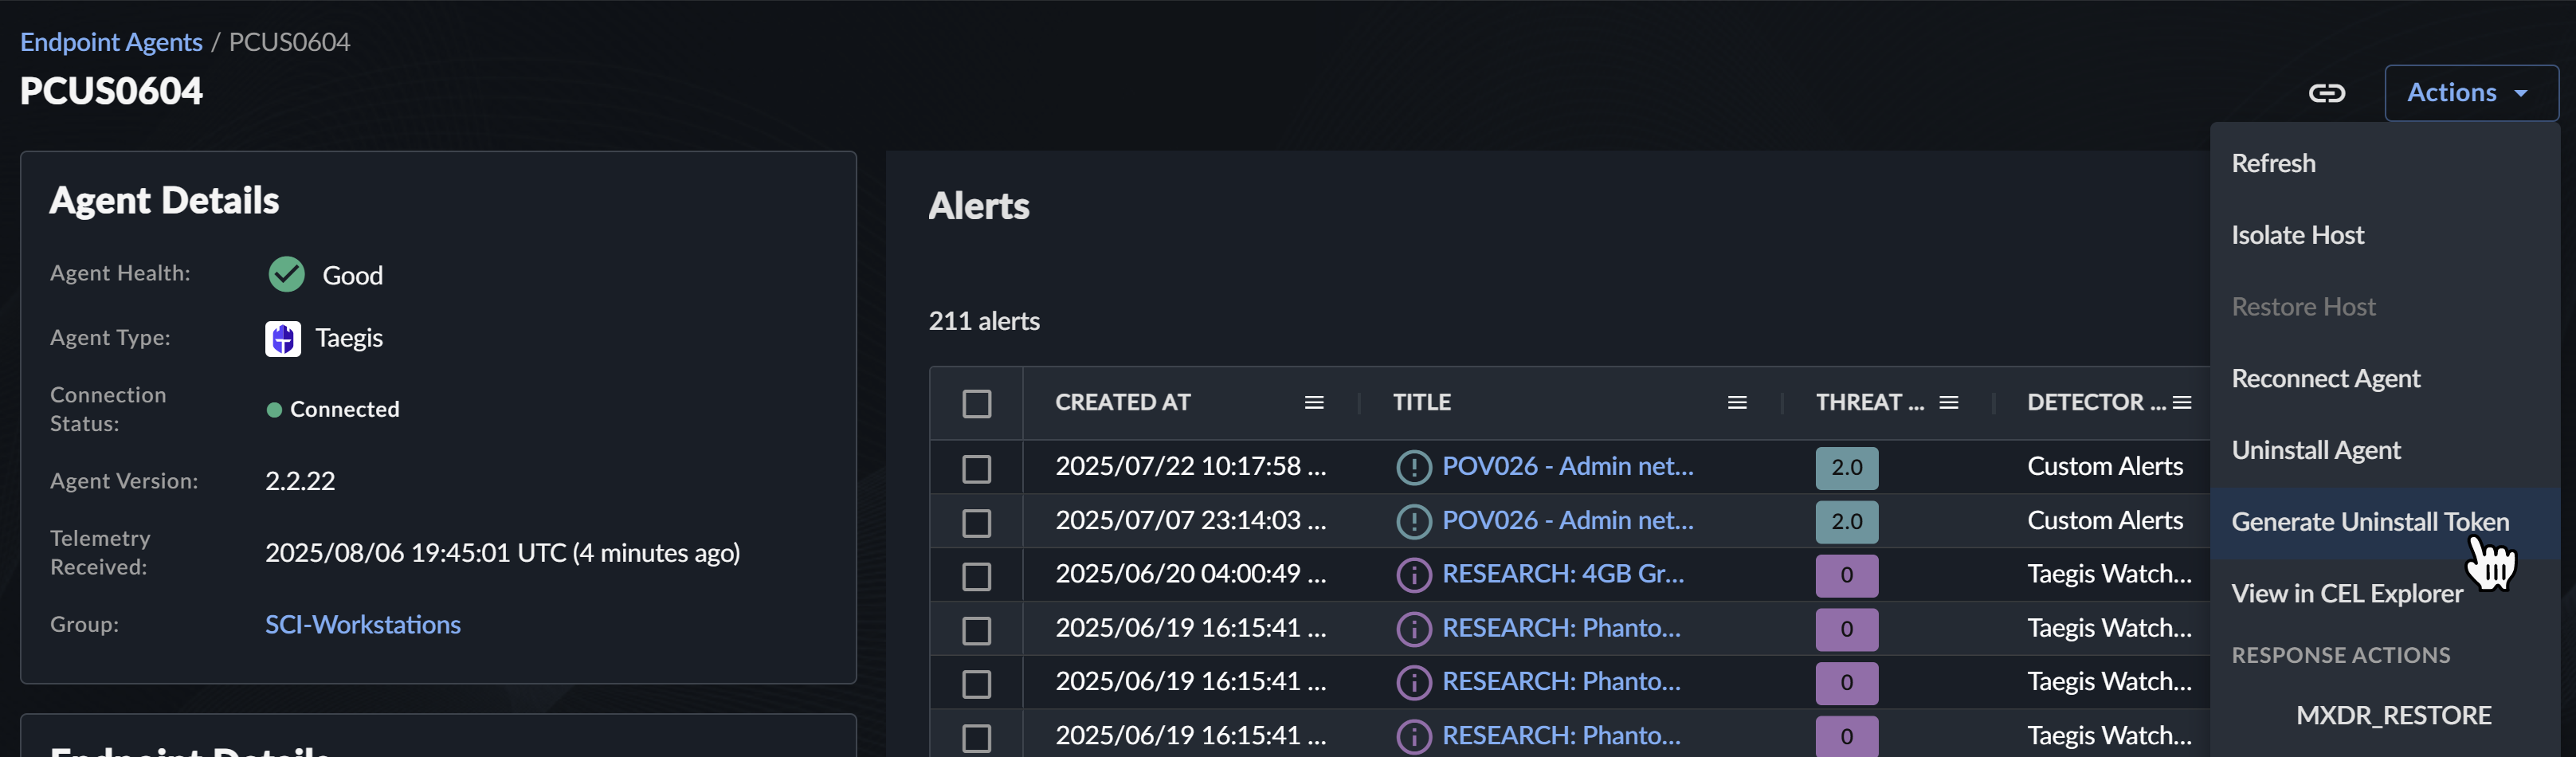
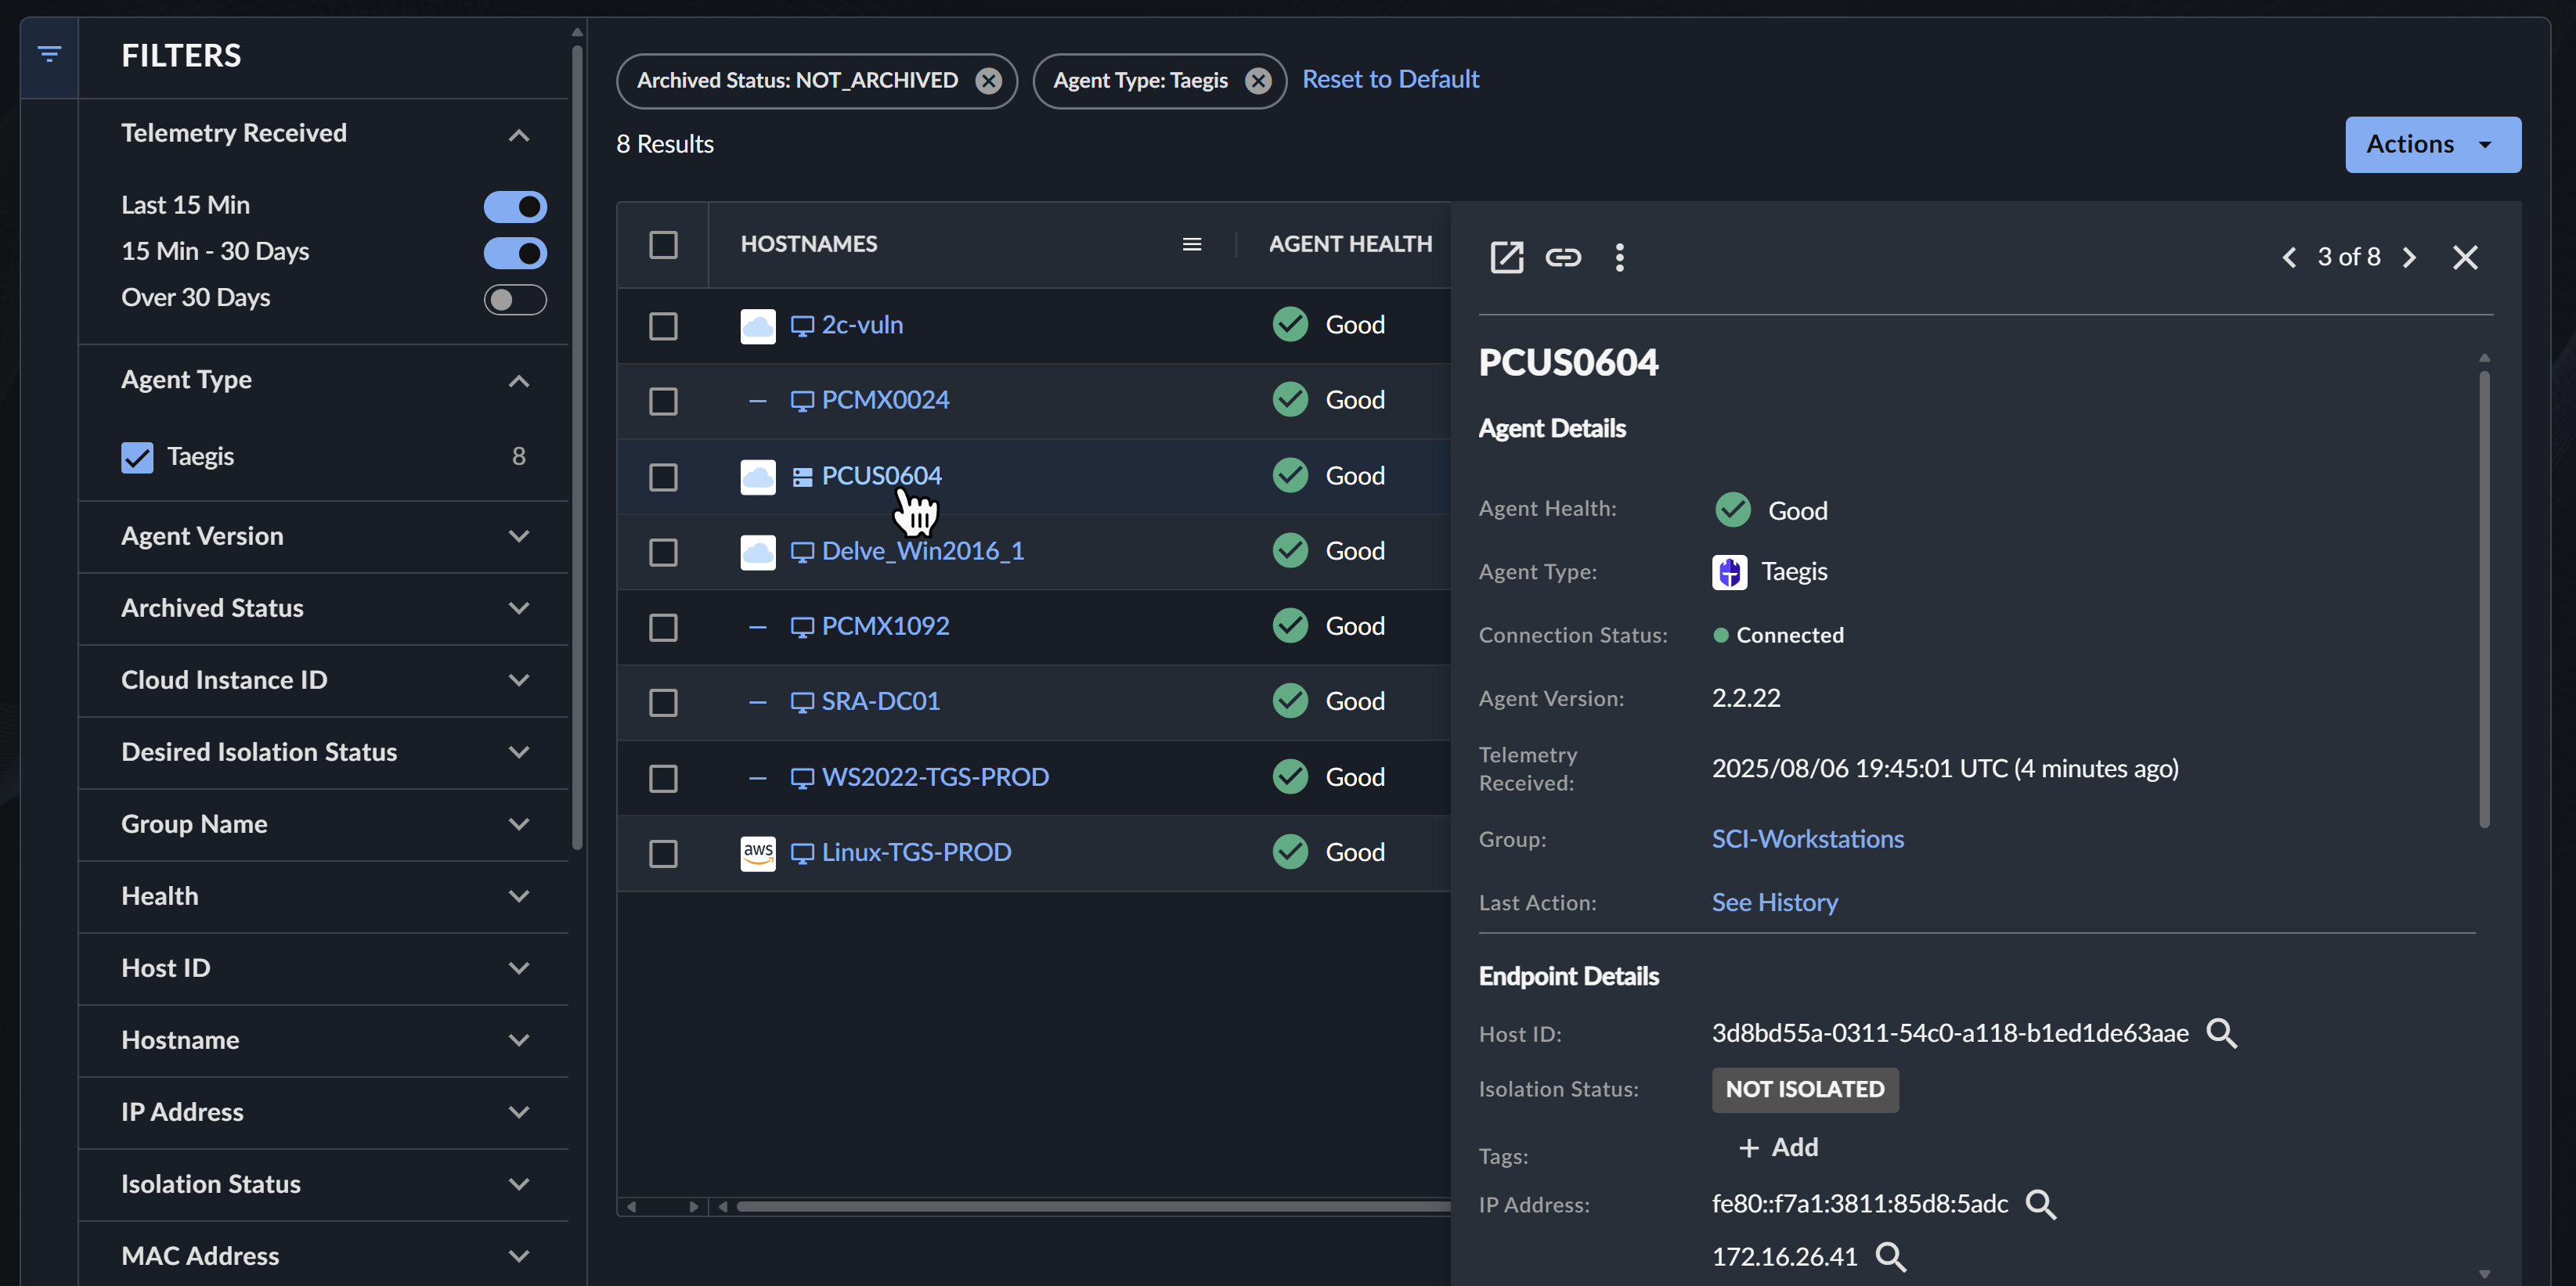
View Endpoint & Agent Details🔗
Select the Hostname entry for an endpoint in the table to open a side drawer summary view of details about the endpoint and its agent.
For a detailed view, select the Open in new tab icon from the summary.

Tip
A badge representing the isolation status displays in the Endpoint Details of the summary and detailed view when a related action is taken.
Agent Details🔗
The Agent Details section displays information about the agent running on the endpoint, including:
-
Agent Health as reported by the vendor:
- For Taegis Endpoint Agents and Red Cloak Endpoint Agents, this is based on the recency of telemetry: agents seen in the last 30 days are
Goodand those not seen in more than 30 days areCritical. - For third-party agents, if the vendor does not report a health status, then no value is shown for Agent Health.
- For Taegis Endpoint Agents and Red Cloak Endpoint Agents, this is based on the recency of telemetry: agents seen in the last 30 days are
-
Agent Type, Version, with the Connection Status for Taegis Endpoint Agents.
- Time and date of the last telemetry received.
Additional information may be available depending on the agent type.
Endpoint Details🔗
The Endpoint Details section displays information about the endpoint. From this section you can:
- View the agent's Host ID.
- View the host's isolation status.
- Identify the endpoint’s last user.
- Apply or remove a tag.
- Run a pivot search against any field with a magnifying glass icon by selecting the icon.
Vulnerabilities🔗
For XDR tenants that also subscribe to Secureworks® Taegis™ VDR, the Vulnerabilities section of the detailed view displays vulnerabilities identified by VDR affecting the endpoint, if it has been mapped to an asset in VDR.
To view more details about the listed vulnerabilities, navigate to the Vulnerabilities view of VDR. For more information, see Finding, Filtering, and Sorting Vulnerabilities in the VDR Documentation.
Tip
Add the Vulnerability Column to the Endpoint Agents Summary table for a quick look at the rollup vulnerability score for endpoints.
Detections🔗
The Detections section of the detailed view displays detections generated from the telemetry that endpoint generated and sent to XDR.
Expand or collapse the section by selecting the header, and select a detection from the list to open a side drawer view.
Filter the table and customize the view by selecting a column header menu icon and choosing the filter or column tab. Use the Actions menu directly above the table to take action on all or selected detections.
Execution History🔗
The Execution History section of the detailed view displays a table of recent playbook executions for the endpoint.
Use the filter chips to filter the table based on the execution state, and customize the view by selecting a column header menu icon and choosing the filter or column tab.
Select one or more checkboxes in the table and then choose to export the list as CSV, cancel the executions, or re-execute them using the icons above the table.
Command History🔗
For Red Cloak Endpoint Agents and Taegis Endpoint Agents, the Command History section of the detailed view displays a list of actions taken for the endpoint, including the user that initiated the action and the reason they supplied for doing so.
Expand or collapse the section by selecting the header, and filter the table and customize the view by selecting a column header menu icon and choosing the filter or column tab.
Red Cloak Endpoint Agent Module Status🔗
For Red Cloak Endpoint Agents only, the Module Status section displays the last time each of a Red Cloak Endpoint Agent ’s modules last reported to XDR. This information can aid in identifying problems with the Red Cloak Endpoint Agent ’s modules.
The status of each module except Mukluk is represented by the following colors, which are updated in XDR every four hours:
- Green — The module has reported data in the last 24 hours.
- Yellow — The module has not reported any data between 24 and 72 hours.
- Red — The module has not reported any data in over 72 hours.
Note
The Mukluk module status is represented as GREEN if data has been reported in the last 12 hours, YELLOW if data has not been reported between 12 hours and 30 days, and RED if data has not been reported in over 30 days.
Find further information on the Red Cloak Endpoint Agent modules in the Red Cloak Endpoint Agent Technical Details.
Actions🔗
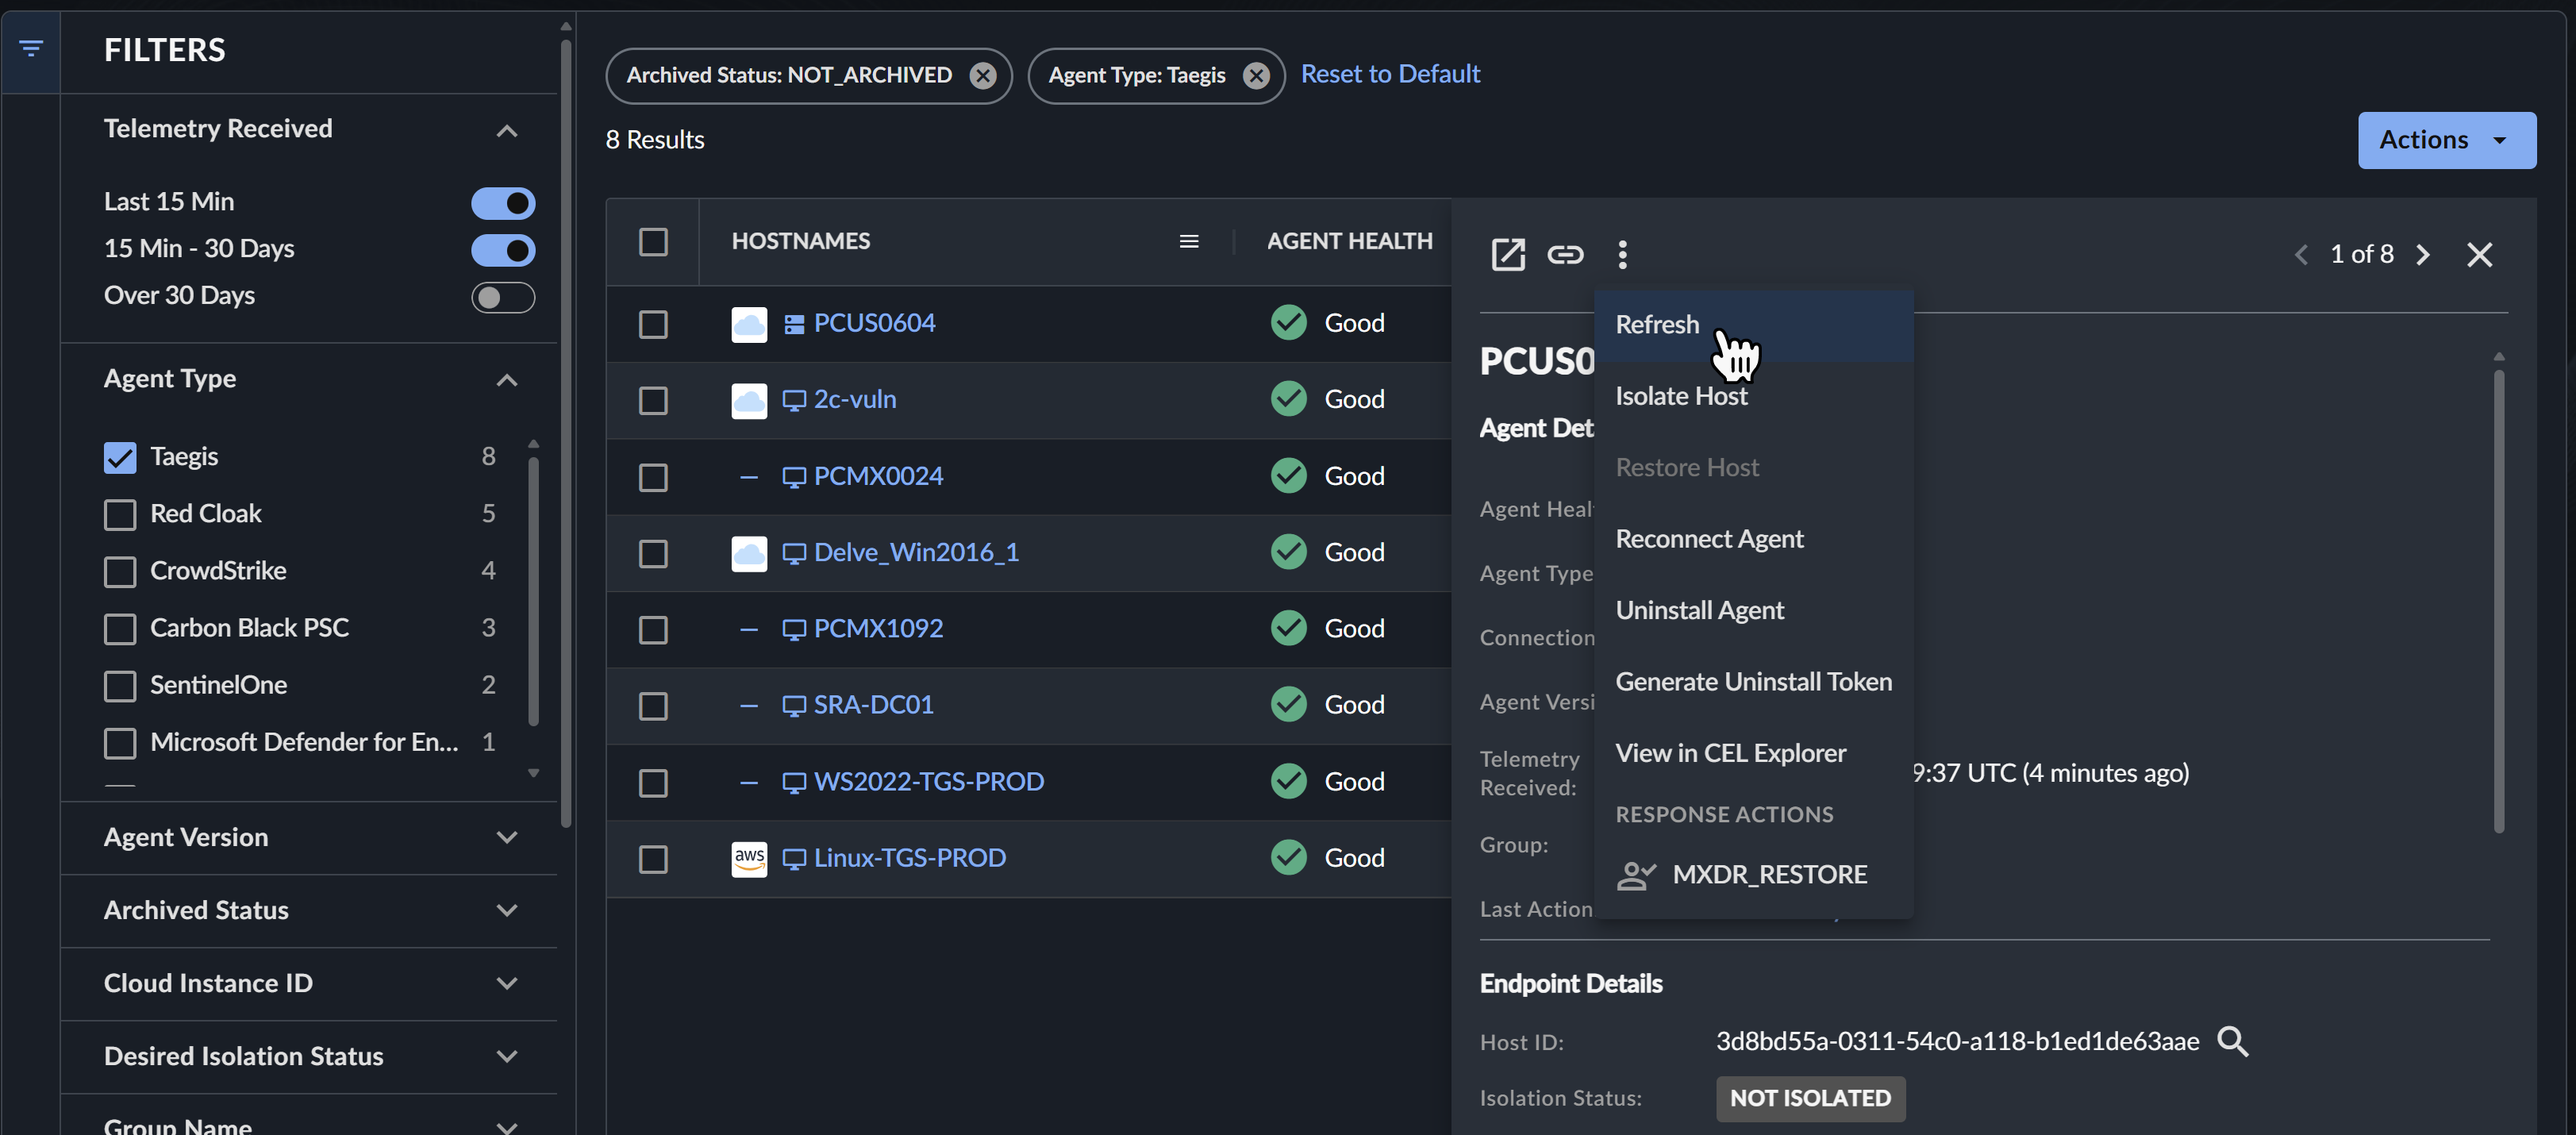
View and take available actions related to an endpoint by selecting the three dot Actions icon from the side drawer summary view or the Actions menu from the detailed view.
The following actions may be available, depending on the agent type, the endpoint status, your tenant subscriptions, your user role, and any automations you have enabled:
-
Refresh — Refresh the data displayed in the summary or detailed view to account for updates such as to the Connection or Isolation status.
-
Isolate Host — Isolate the Host from network connectivity except to XDR.
- Restore Host — Restore the Host to full network connectivity.
- Reconnect Agent — Connect a Taegis Endpoint Agent to the registration server to initiate an auto-update if a new Taegis Endpoint Agent version is available. To perform this action for multiple Taegis Endpoint Agents at once, see Reconnect Taegis Agents.
- Uninstall Agent — Remove a Taegis Endpoint Agent from the endpoint. To perform this action for multiple Taegis Endpoint Agents at once, see Uninstall Taegis Agents.
- Generate Uninstall Token — Generate an uninstall token for Taegis Endpoint Agents with a group policy that has Tamper Protection enabled.
- View in CEL Explorer — Test the outcome of CEL expressions against the endpoint data for use in Automations configurations. For more information, see CEL Explorer.
- Response Actions — Lists playbook automations you have configured as Response Actions.
Note
The Uninstall Agents action is available only for supported Taegis Endpoint Agents that are both Active and Connected. Uninstall Agents is supported by all Windows and Linux versions and macOS version 2.0.9 and later. For other uninstall options, see Taegis Endpoint Agent Uninstall.
Isolate and Restore a Host🔗
Important
Taegis Endpoint Agents behind a full VPN tunnel cannot be restored after being isolated, as they cannot reach the Taegis backend. We recommend using a split-tunneling VPN for Taegis Endpoint Agents. Note that this might also be applicable for other third-party EDR agents.
Note
By default, Taegis Endpoint Agents in an isolated state are limited to agent-related traffic only; to allow additional network traffic to isolated Taegis Endpoint Agents within a specified CIDR range, create an Isolation Exception rule.
Isolating an endpoint from network communication (except to XDR) is performed to prevent lateral spreading of threats from an infected host to healthy hosts. Once isolated hosts have the threat removed, they can be reintegrated and regain full network access.
Tip
Response actions such as isolating and restoring an endpoint can also be enabled via playbooks. For information on configuring playbooks to perform these actions, see Playbooks Templates and related Automations documentation.
Follow these steps to isolate or restore a host via the XDR default Actions menu options:
- From the Taegis XDR menu, select Endpoint Agents → Summary and choose an endpoint from the Endpoint Agents Summary table.
- Select the three dot Actions icon from the Endpoint side drawer summary view or the Actions menu from the Endpoint detailed view.
- Choose either Isolate Host or Restore Host.
-
Enter a reason for the action and select either Isolate Host or Restore Host to confirm.
Isolated hosts display a label in the Isolation Status field of Endpoint Details in the side drawer summary view and the detailed view:
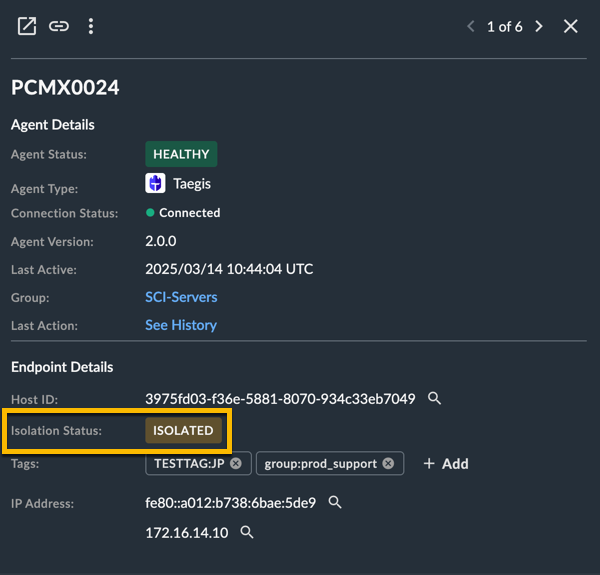
Isolation Status
Note
Disconnected Taegis Endpoint Agents display an Isolation Pending or Restore Pending label until they reconnect to XDR. For more information, see Taegis™ Endpoint Agent Technical Details.
See the Command History section from the endpoint detailed view for a history of isolate and restore actions for the endpoint.
For more information, see Taegis Endpoint Agent Introduction, Isolate a Red Cloak Endpoint Agent, or Sophos Endpoint Agent Introduction
Share Agent Details🔗
To share agent details with another user within the tenant, select the Copy share link icon for a direct URL from either the side drawer summary view or detailed view.