Configure Custom Reports🔗
Reports in Secureworks® Taegis™ XDR can be generated from a search query. A report can be configured to run one time or at a scheduled recurrence. By default reports output to PDF format, with the option to include a CSV format as well.
Available Custom Report Types🔗
The following report visualizations are available to download as a PDF file format.
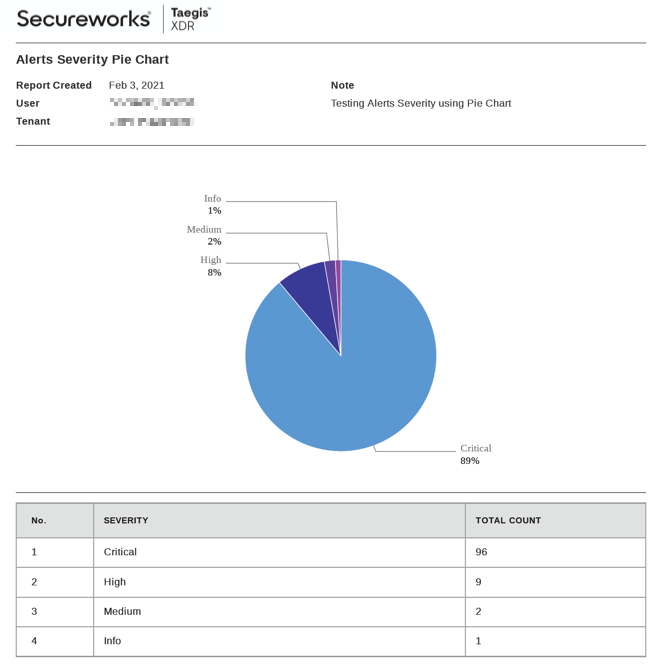
Pie Chart🔗
Pie charts are appropriate for comparing proportions of value.
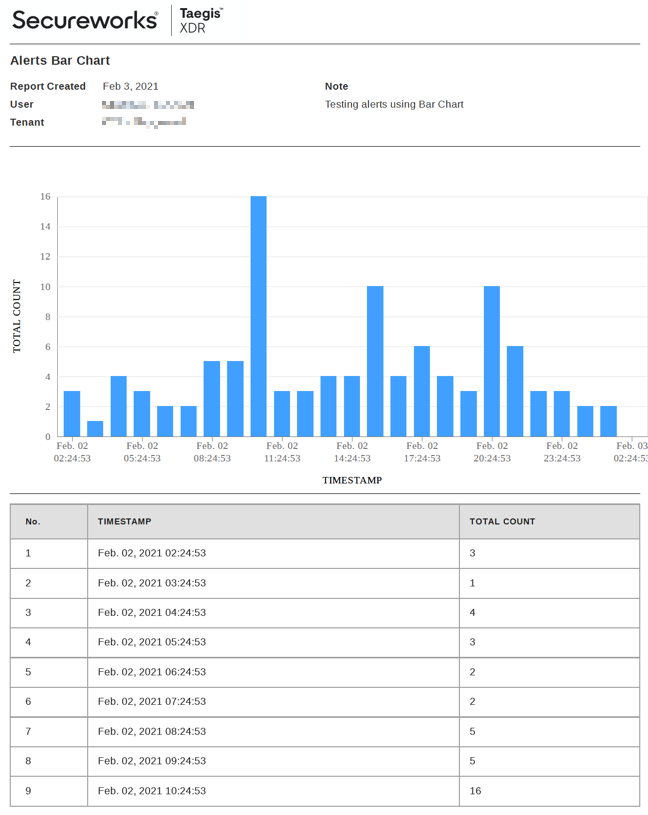
Bar Chart🔗
The bar chart is appropriate for observing a trend over time of a single series of data. It has a vertical orientation.
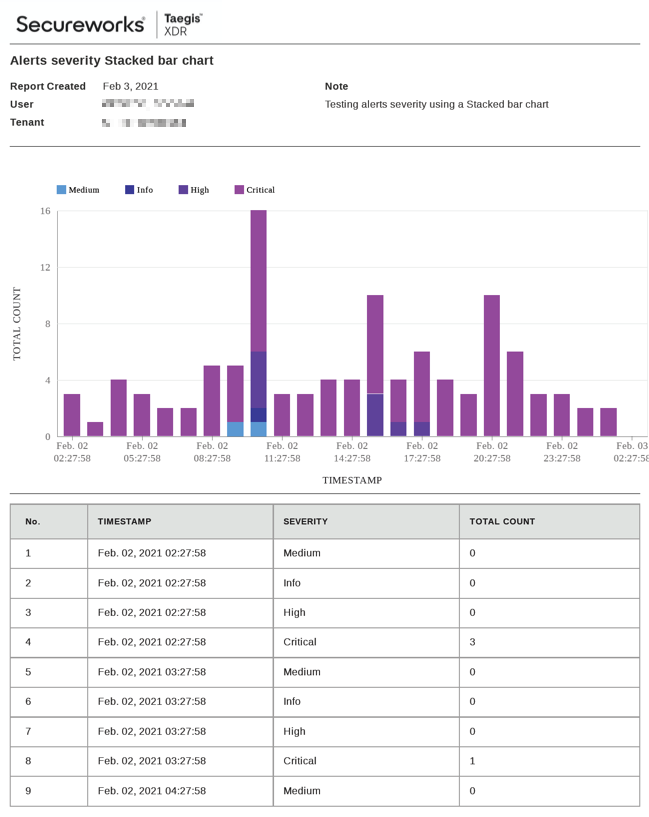
Stacked Bar Chart🔗
The stacked bar chart is appropriate for observing a trend over time of multiple series of data. It has a vertical orientation.
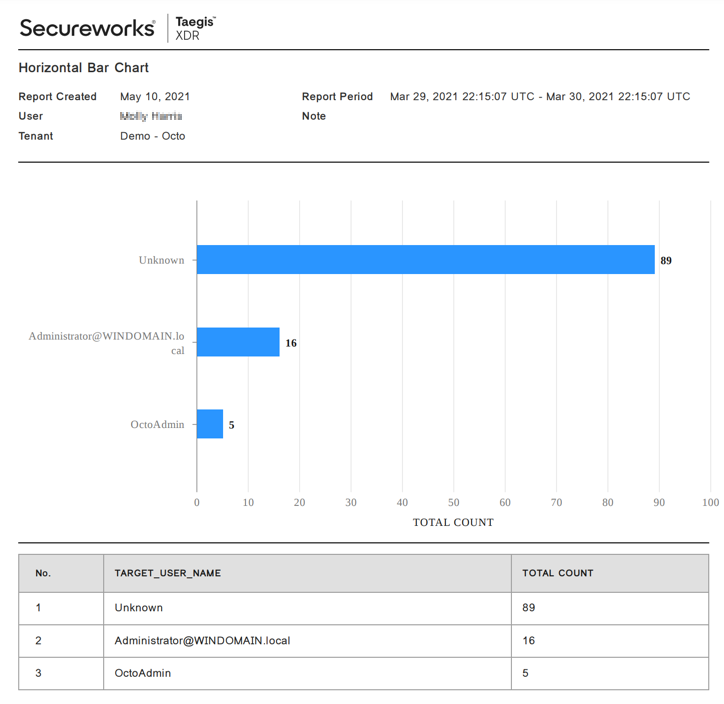
Horizontal Bar Chart🔗
The horizontal bar chart is appropriate for observing a part to whole trend of a single series of data.
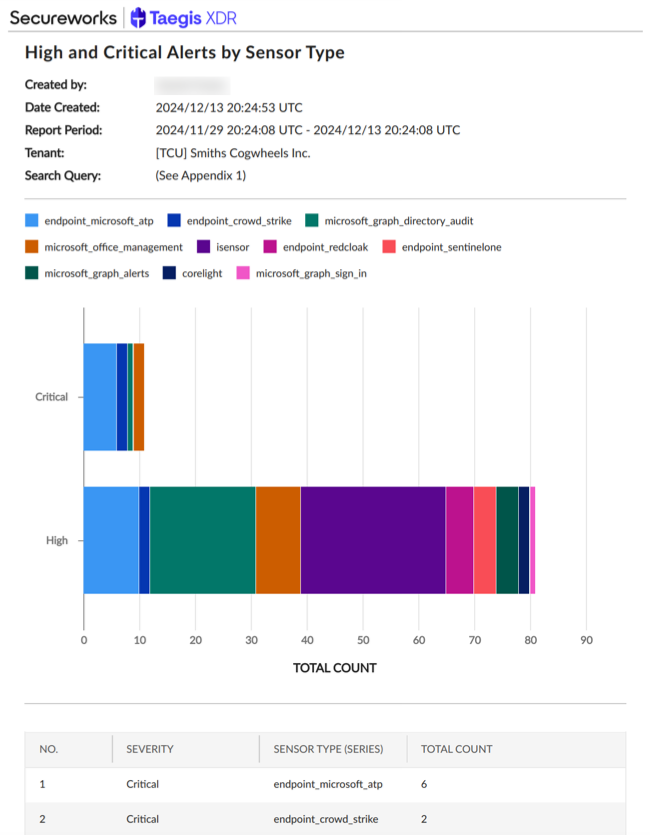
Horizontal Stacked Bar Chart🔗
The horizontal stacked bar chart is appropriate for observing a part to whole trend of multiple series of data.
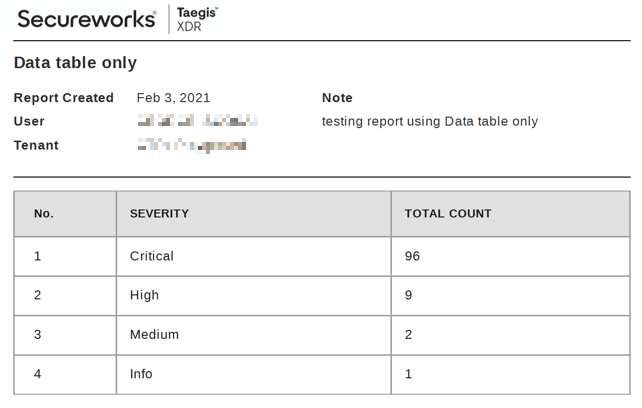
Data Table Only🔗
Choose this option to exclude any chart visualization and only include the resulting data table.
Set up the Report Query🔗
The basis of all reports begins with a search query. Once a query has been formed and executed, the ability to generate a report becomes available.

To create a report:
- Select Advanced Search from the Taegis Menu and choose Data Lake Search.
- Craft a search query.
- Select Search to run the search.
- Review the resulting data table to ensure the expected results appear.
- At the top right of the results data table, select Create Report to begin the report creation workflow. The Report Configuration panel is displayed.
Note
Search currently only supports Events and Detections schemas. View supported schemas in the Schema Library.
Note
Search for Events is restricted to a 31-day time period and a result set of no greater than 100,000 records. If more records are needed, it is recommended to refine the search query and perform multiple queries/reports.
Configure the Report🔗
A report contains multiple properties that can be adjusted depending on what you’d like the report to present. These properties include:
- The type of visualization (aka graph or chart) to use
- The series or segments of the visualization
- How often and when to execute a report
- The report title and description
- Named account users you will share the completed report with
Tip
There is a preview of the search query results in the left-hand side of the Report Configuration panel, for quick reference while configuring the report. You can page through the results using the left and right arrows.
After each step, select Next to proceed to the next configuration step.
Step 1: Visualization Settings🔗
There are two visualization settings in this step: choosing the appropriate type of chart or graph to generate, and choosing the output file format.
Available Charts🔗
Select the type of chart or graph needed to visualize the data. The available options are:
- Pie Chart — Appropriate for comparing proportions of value
- Bar Chart — Appropriate for observing a trend over time of a single series of data
- Stacked Bar Chart — Appropriate for observing a trend over time of multiple series of data
- Horizontal Bar Chart — Appropriate for observing a part to whole trend of a single series of data
- Horizontal Stacked Bar Chart — Appropriate for observing a part to whole trend of multiple series of data
- Data Table Only — Only includes the resulting data table; excludes any other visualization
Note
If the search query performed is not compatible with a visualization, the option will be disabled.
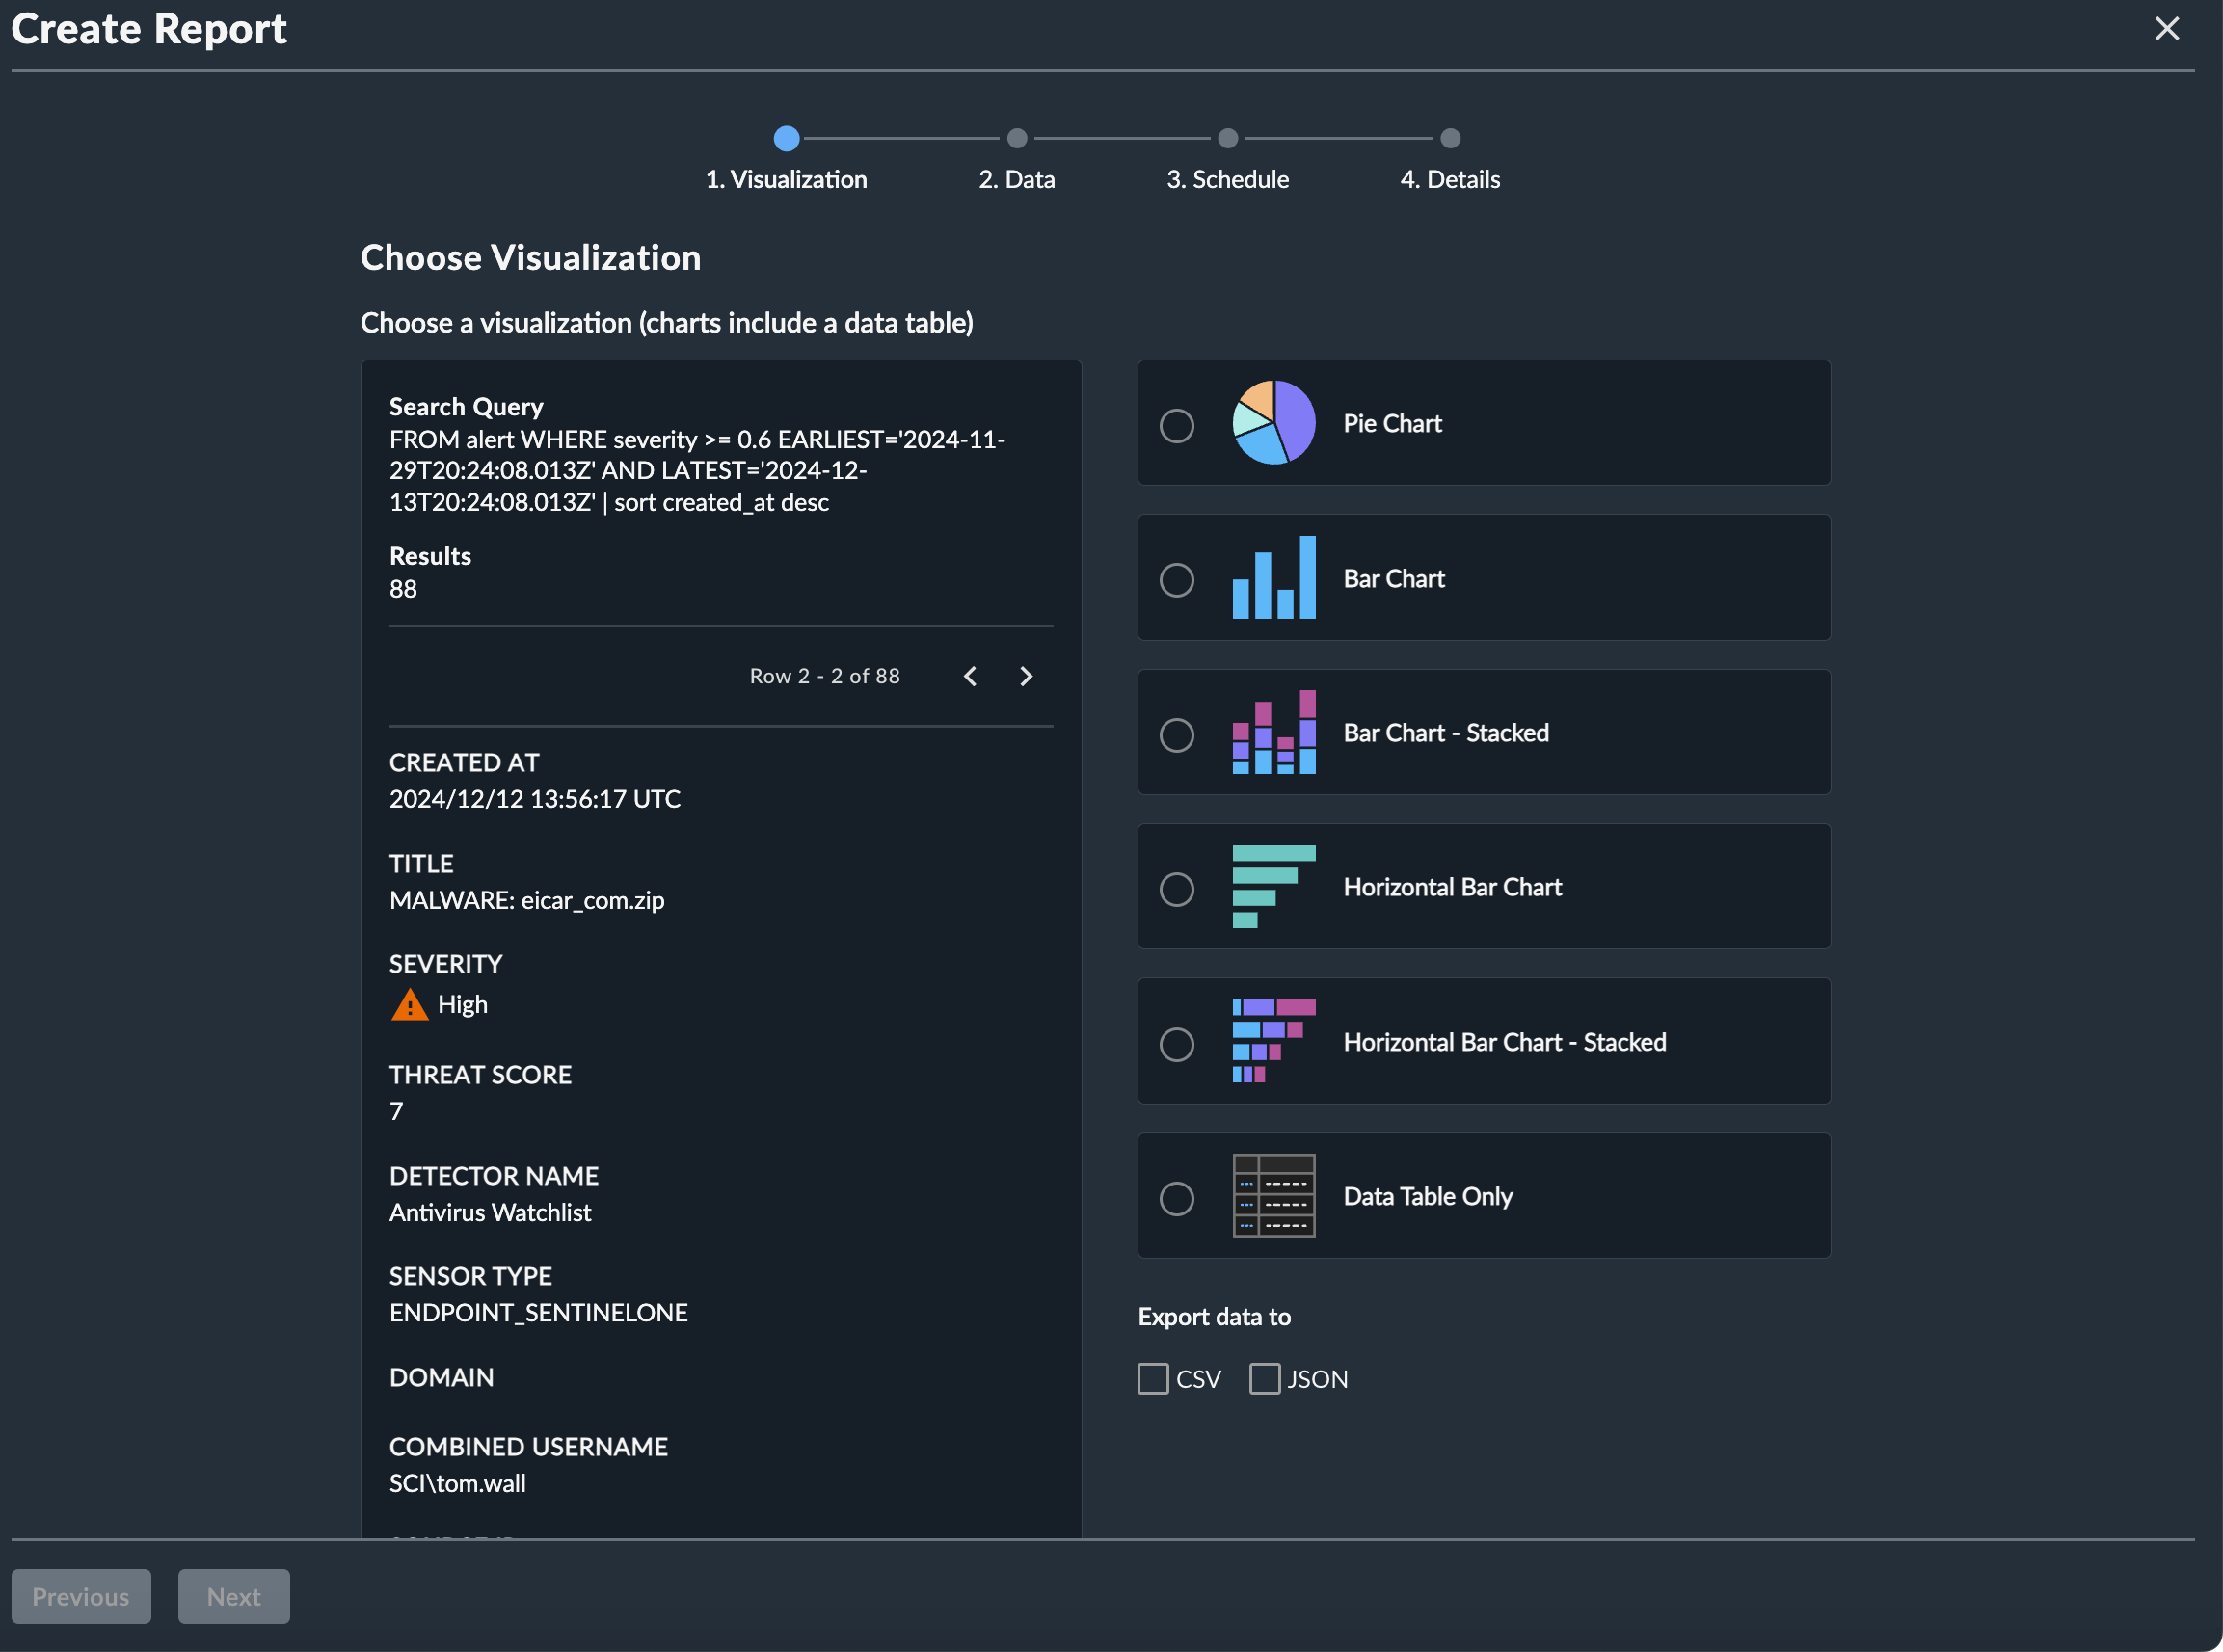
Available Output File Formats🔗
Reports are generated as PDF files by default. This file includes the metadata defined by the user during the configuration process, the selected visualization of the query results, and a data table containing the aggregated query results.
To generate a CSV and/or JSON file that contains the non-aggregated data from the search query with the PDF:
- Select a chart type.
- Select the Export data to CSV and/or JSON option below the chart types.
Tip
If you want a CSV and/or JSON file only and not a PDF, do not select any of the chart types; only select the CSV and/or JSON option.
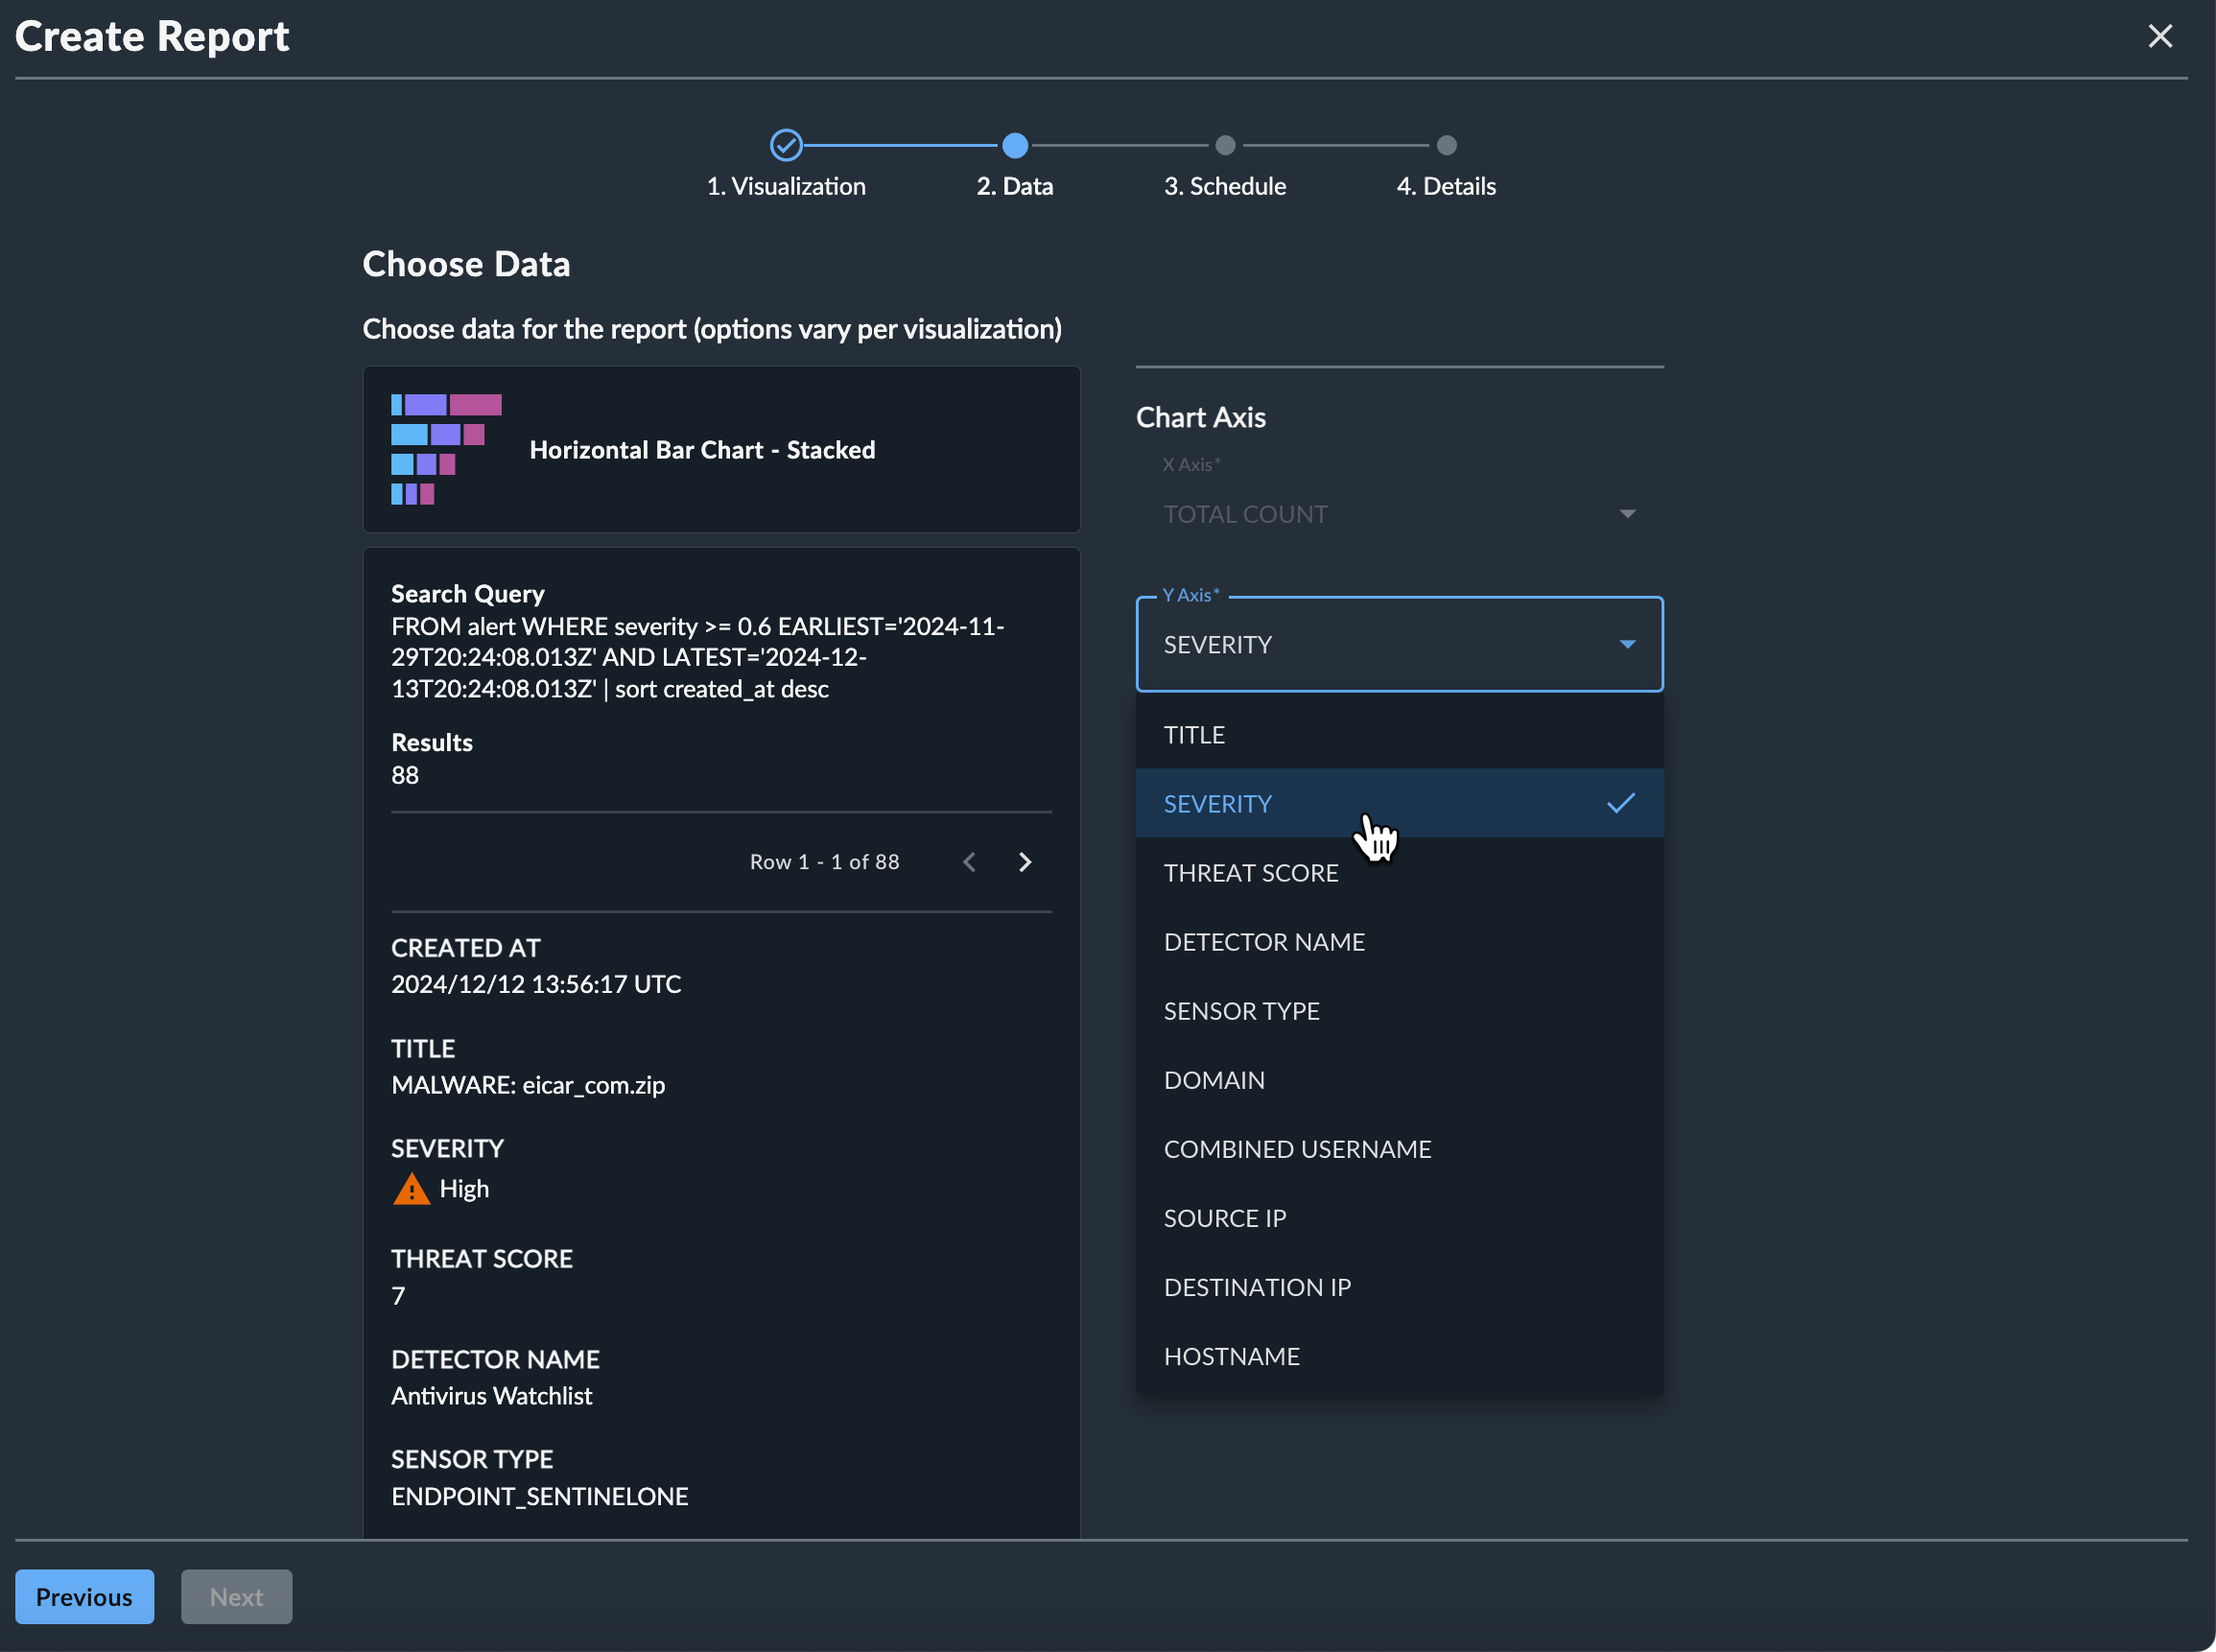
Step 2: Configure Report Data🔗
Depending on the type of report visualization you selected in step 1, you may have the option of configuring the data that will be included in your report.
Pie Chart🔗
Select the category that should be used to group the segments of the pie.
Vertical Bar Chart🔗
The bar chart is preconfigured with timestamp on the X-axis and total count (aka the aggregate value) on the Y-axis.
Stacked Vertical Bar Chart🔗
The stacked bar chart is preconfigured with timestamp on the X-axis and total count (aka the aggregate value) on the Y-axis. Select the series (aka the category) that should be used to group the segments of the bars.
Horizontal Bar Chart🔗
The horizontal bar chart is preconfigured with total count (aka the aggregate value) on the X-axis. Select the category that should be used on the Y-axis.
Horizontal Stacked Bar Chart🔗
The horizontal stacked bar chart is preconfigured with total count (aka the aggregate value) on the X-axis. Select the category that should be used on the Y-axis, and the series (aka the category) that should be used to group the segments of the bars.
Data Table Only🔗
Select the category to group the data by and sum the value of.
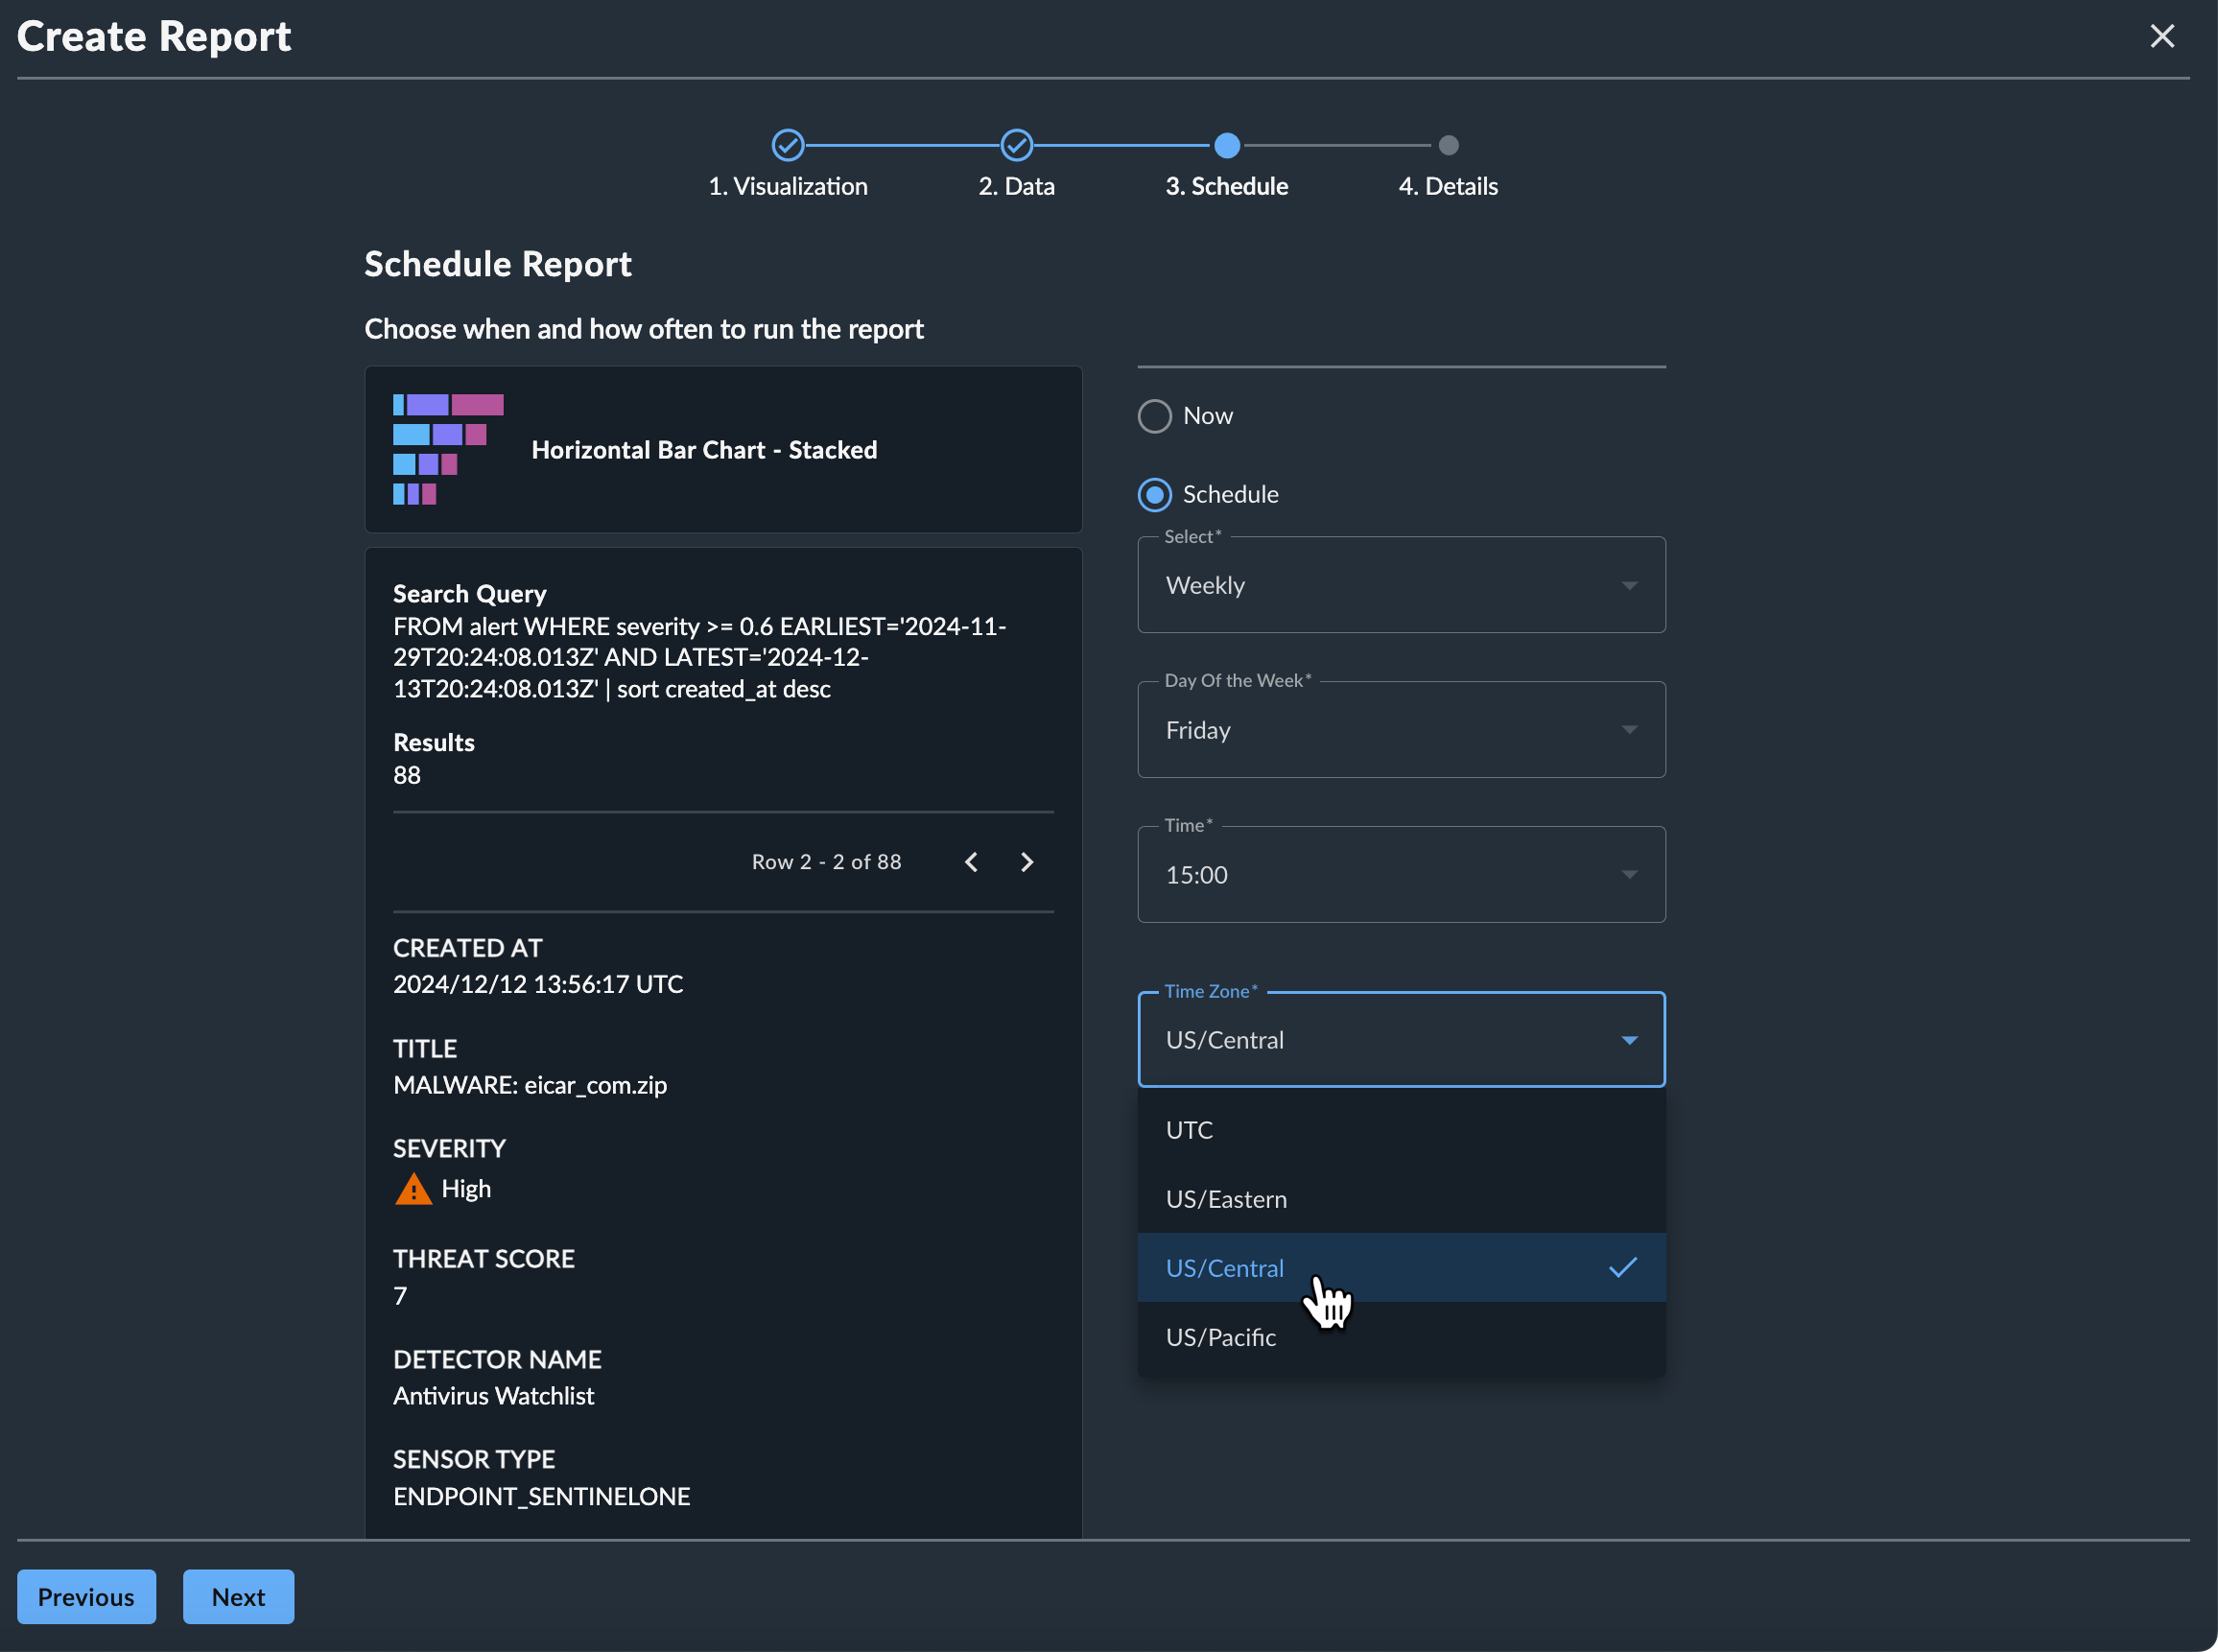
Step 3: Schedule Report🔗
A report can be scheduled to run at a variety of intervals as defined below. One scheduling option may be defined per report.
- Now — The report is executed immediately upon completion of the configuration process.
- Once — The report is executed once at a date and time specified by the user.
- Daily — The report is executed once every day of the week at a designated time.
- Weekly — The report is executed once per week on a specified day and time.
- Monthly — The report is executed once per month on a specified numeric day of the month and time. If the defined day is greater than the last day of the month, the report will be executed on the last day of the month.
- Annually — The report is executed once per year on a specified date and time.
Note
The time zone field specifies what time zone a scheduled report should run; it does not affect the timestamps used throughout the report data.
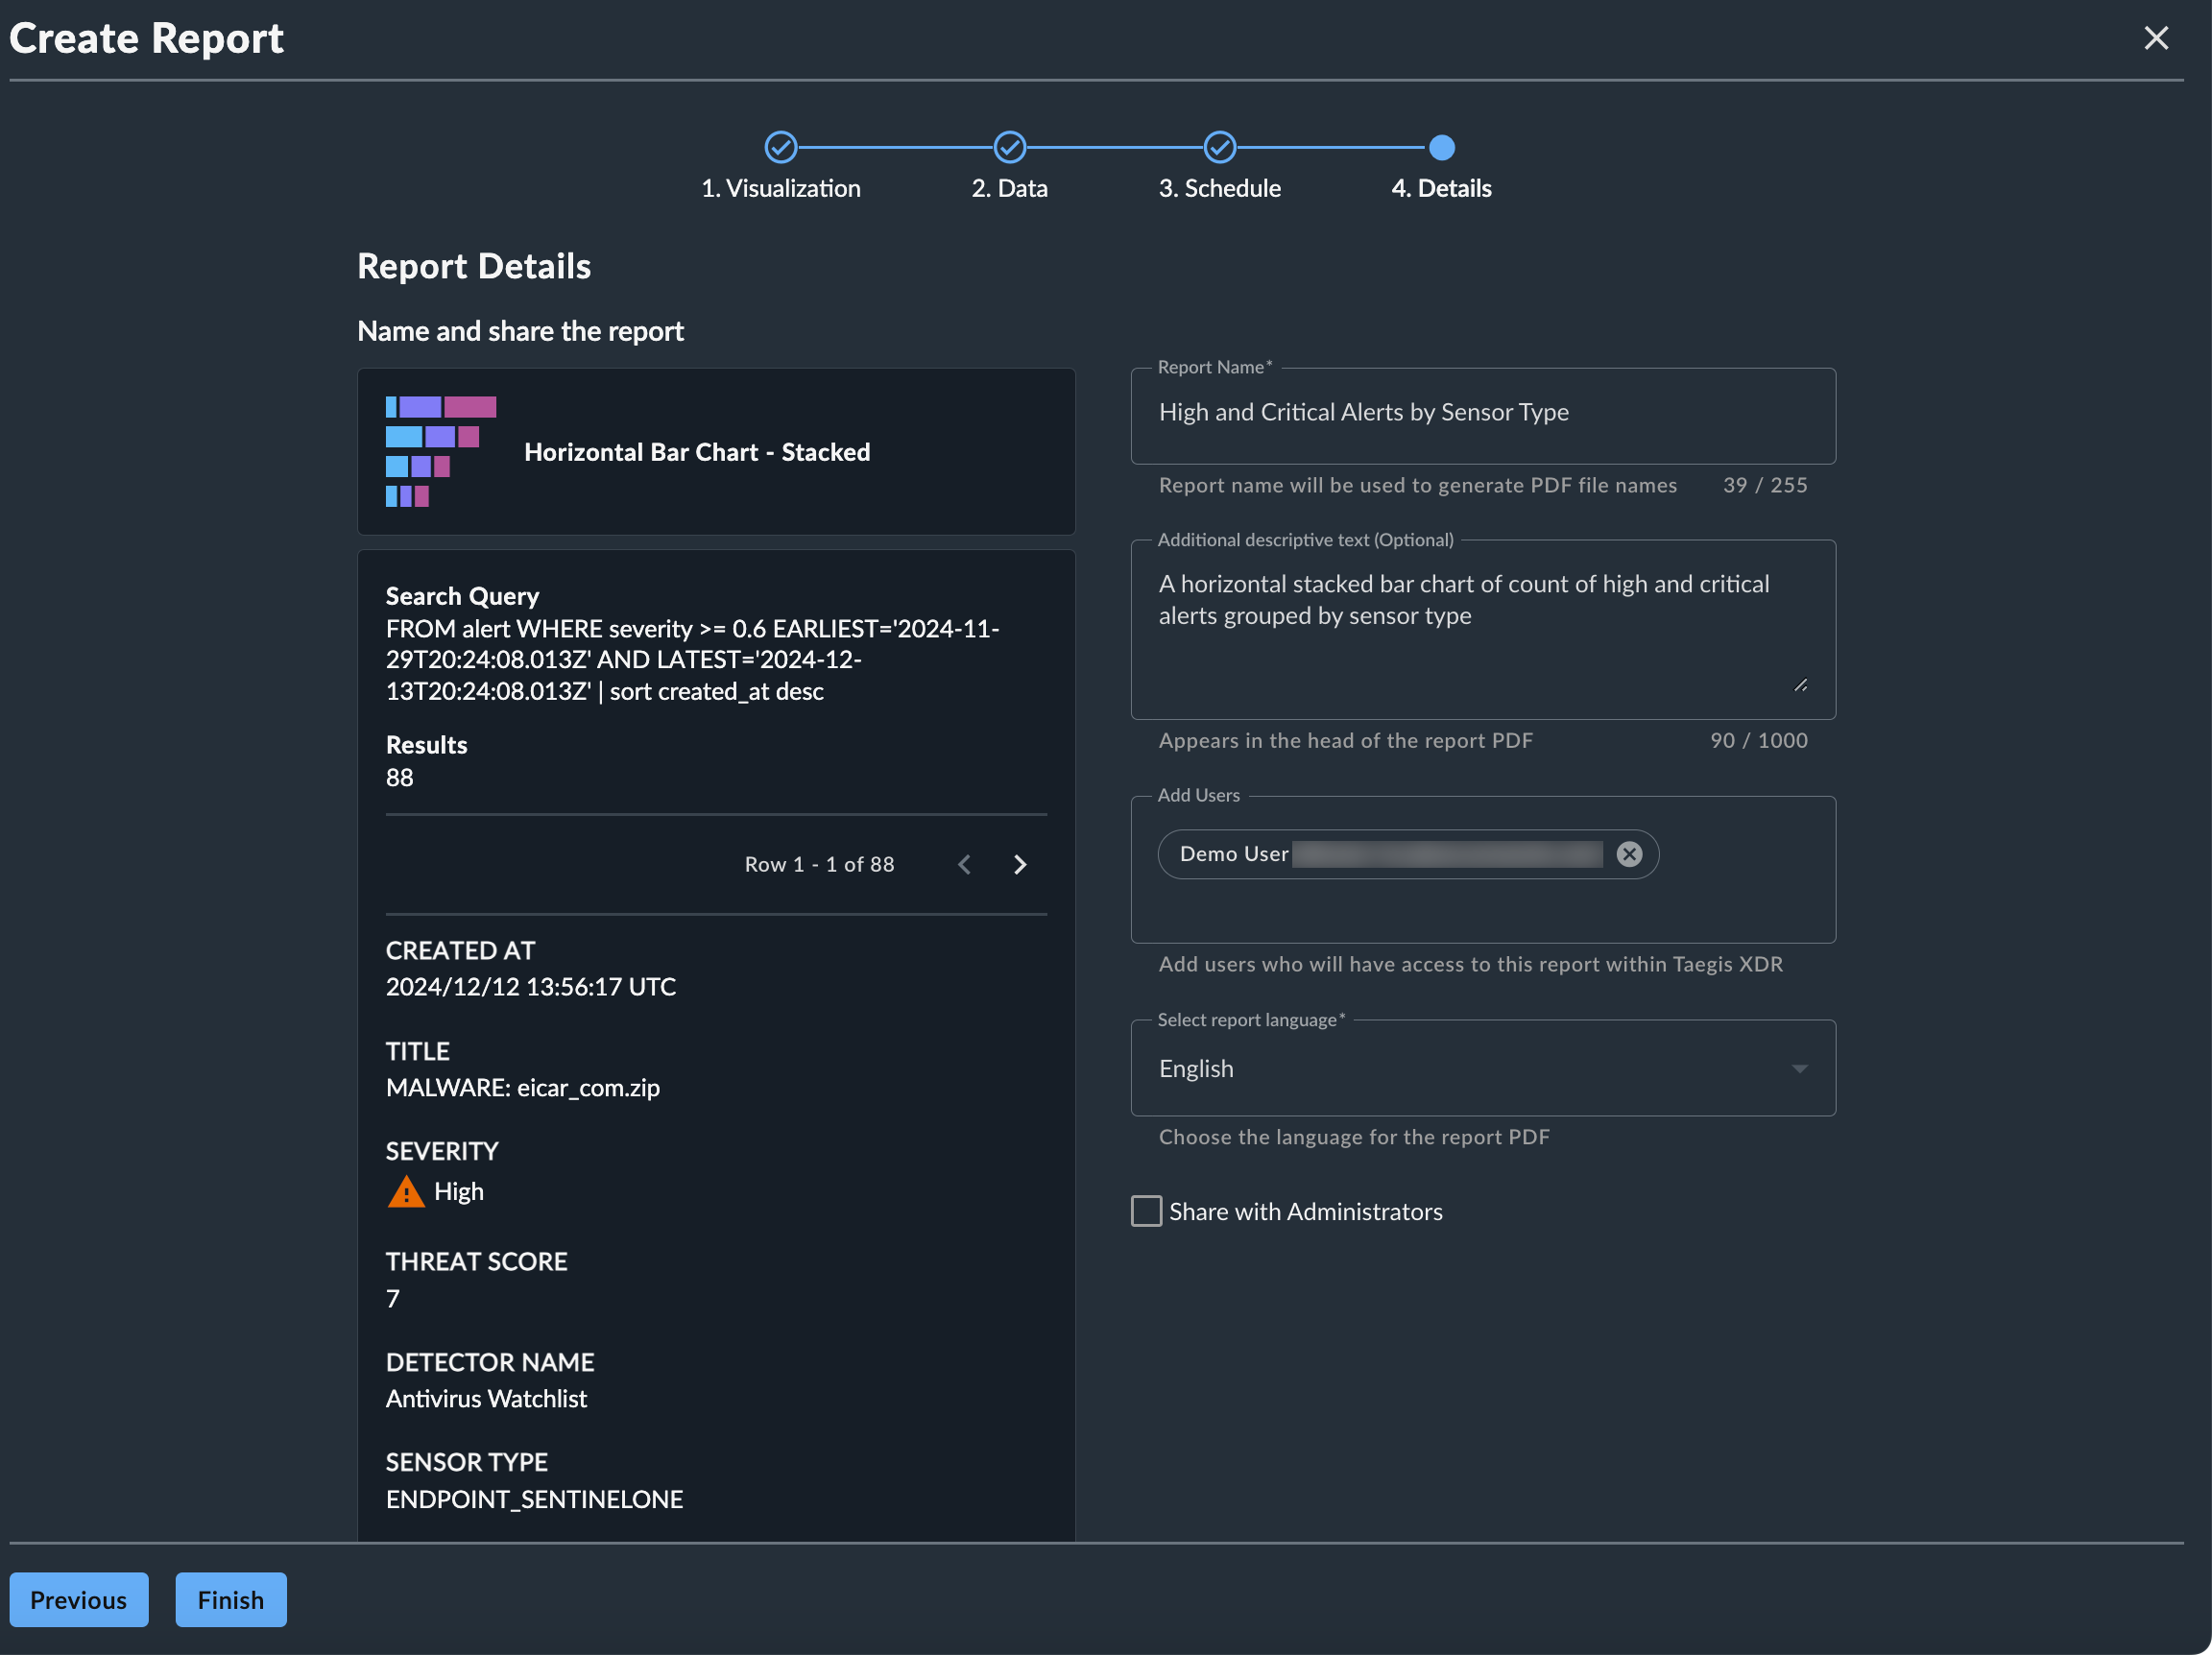
Step 4: Report Name and Sharing🔗
In the last step of report configuration, define the following:
- Report Name — A name for the report, which is used as the file name, the header inside the file, and a quick reference in the Scheduled and Completed Reports tables. (255 character limit; supported characters:
/ - _ ( ) % & # ! , . ' " @ $ ^ * ~) - Description — (Optional) Descriptive text that provides context of the contents of the report for recipients’ benefit. This is embedded in the header of the report file. (1,000 character limit)
- Users — Any XDR users within the current tenant that will receive the report. Each named user, including the report creator, will receive email notifications when the report is completed, with a link to download the report. Users you share the report with can unsubscribe if they do not wish to receive the report.
- Report Language — Choose from English or Japanese - 日本語.
- Share with Administrators — Check this option to add the report to the Completed Reports table for Tenant Administrator users when it runs. They will not receive notifications for the report.
Note
You automatically receive any report that you create yourself; you do not need to add yourself to the user list.
Step 5: Complete the Report🔗
After all configuration steps are completed, select Finish. The query results page is displayed, with a banner informing you that the report is being created. You will receive an email notification when it is ready to download.