Detection Triage Dashboard🔗
Note
The terms Alerts and Investigations have recently been changed to Detections and Cases in Taegis XDR. You may still see references to the old terms while we continue to work towards platform convergence of Sophos and Taegis technologies. For more information, see Taegis Terminology Updates.
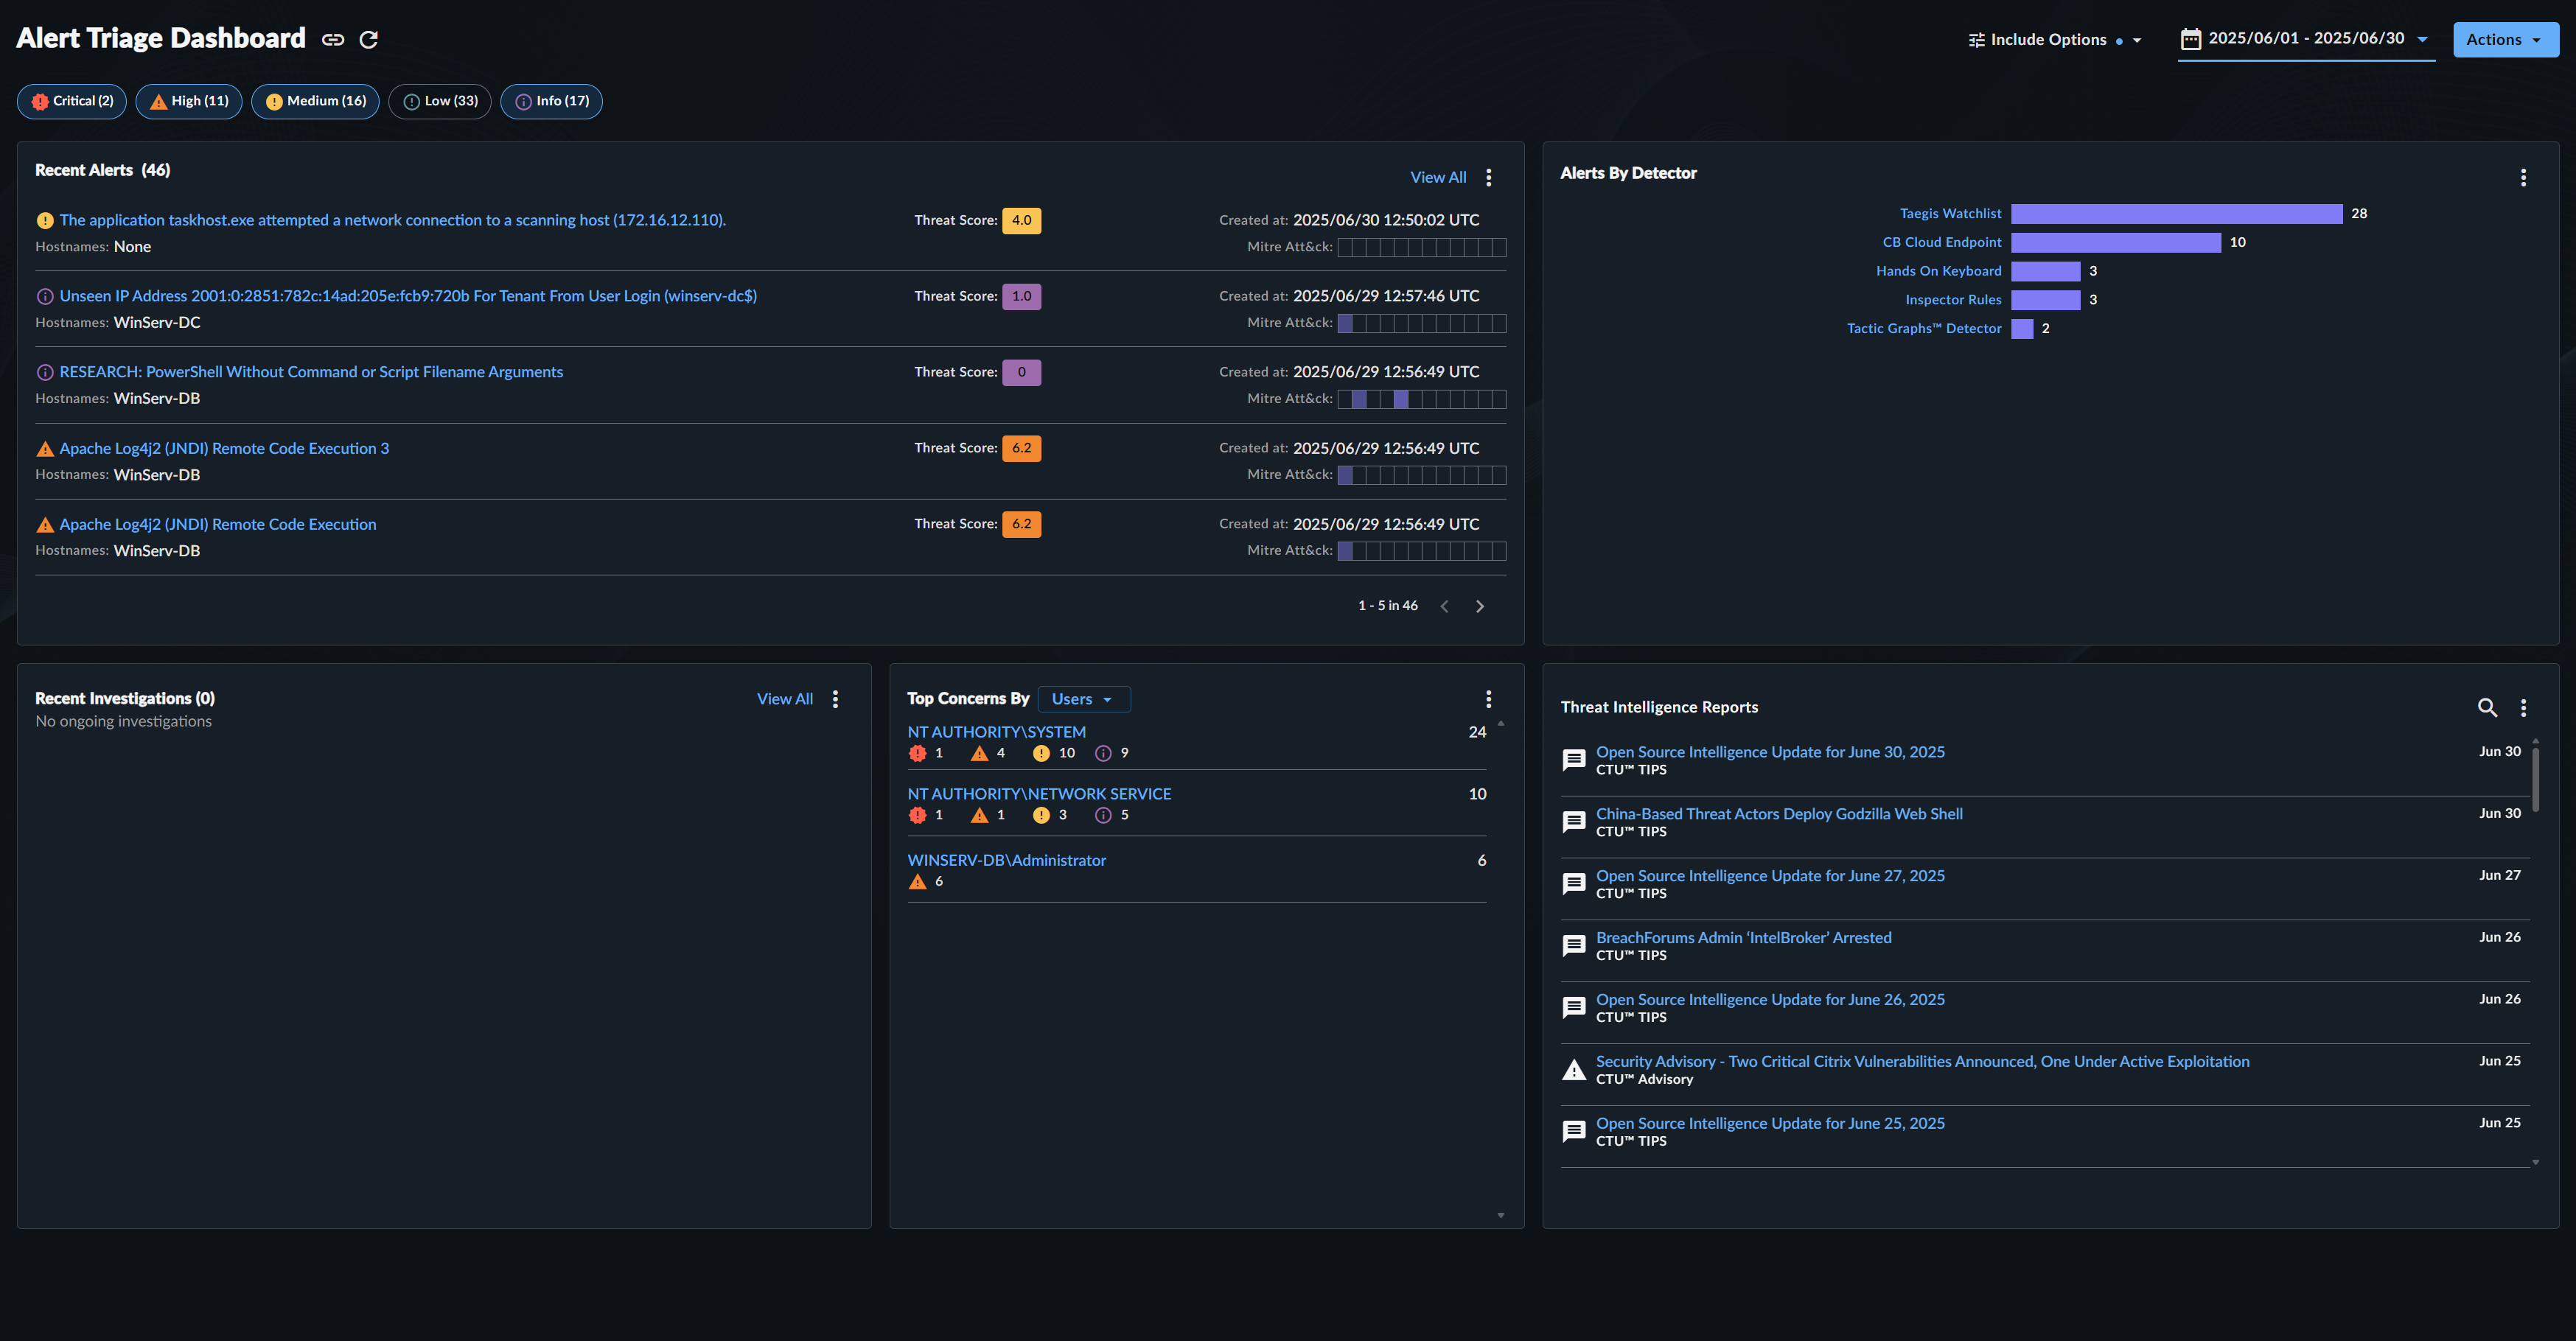
Use the Detection Triage Dashboard to view activity in your environment and quickly assess possible ongoing threats or notifications of suspected deleterious actions.
Get to the Detection Triage Dashboard🔗
- From the Taegis Menu, select Dashboards > Detection Triage.
- The Dashboard displays.
Edit Dashboard Settings🔗
Severity🔗
Filter all Detection Triage Dashboard widgets by detection severity using the severity filter chips at the top of the dashboard. All are selected by default; deselect those you wish to exclude.

Date/Time🔗
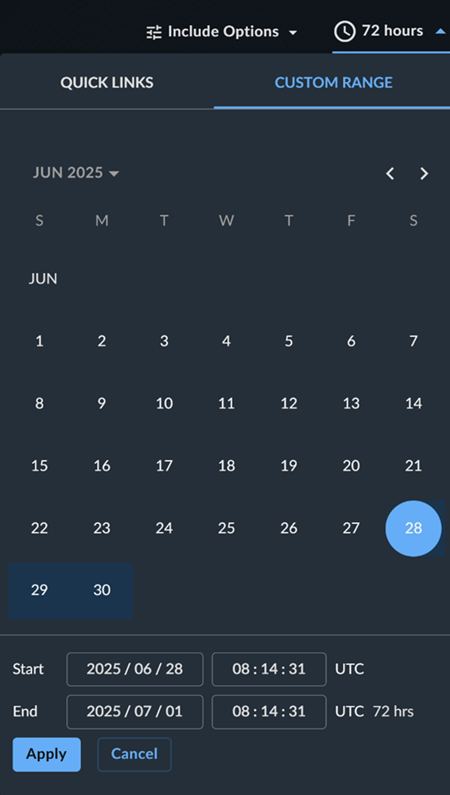
The Detection Triage Dashboard uses master date/time settings, which change the time period of all widgets at the same time.
Change the time period using the drop-down date/time picker at the top right of the dashboard. The default time period is 72 Hours, but choosing a custom time period overwrites it. The most recent time period selected becomes the new default.
Custom Detections🔗
To include detections that match your custom detection rules, open Include Options at the top right and select Custom Detections.

Refresh Dashboard🔗
To refresh the data in all widgets of the Detection Triage Dashboard, select the Refresh Dashboard icon at the top of the dashboard.

Widgets🔗
The Detection Triage Dashboard includes the following widgets:
Recent Detections🔗
The Recent Detections widget displays all detections that are open and not related to a case. The title, created date and time, hostname, and MITRE ATT&CK framework category of each detection are displayed.
Tip
Recent Detections gives you a method to focus and triage new detections at a glance.
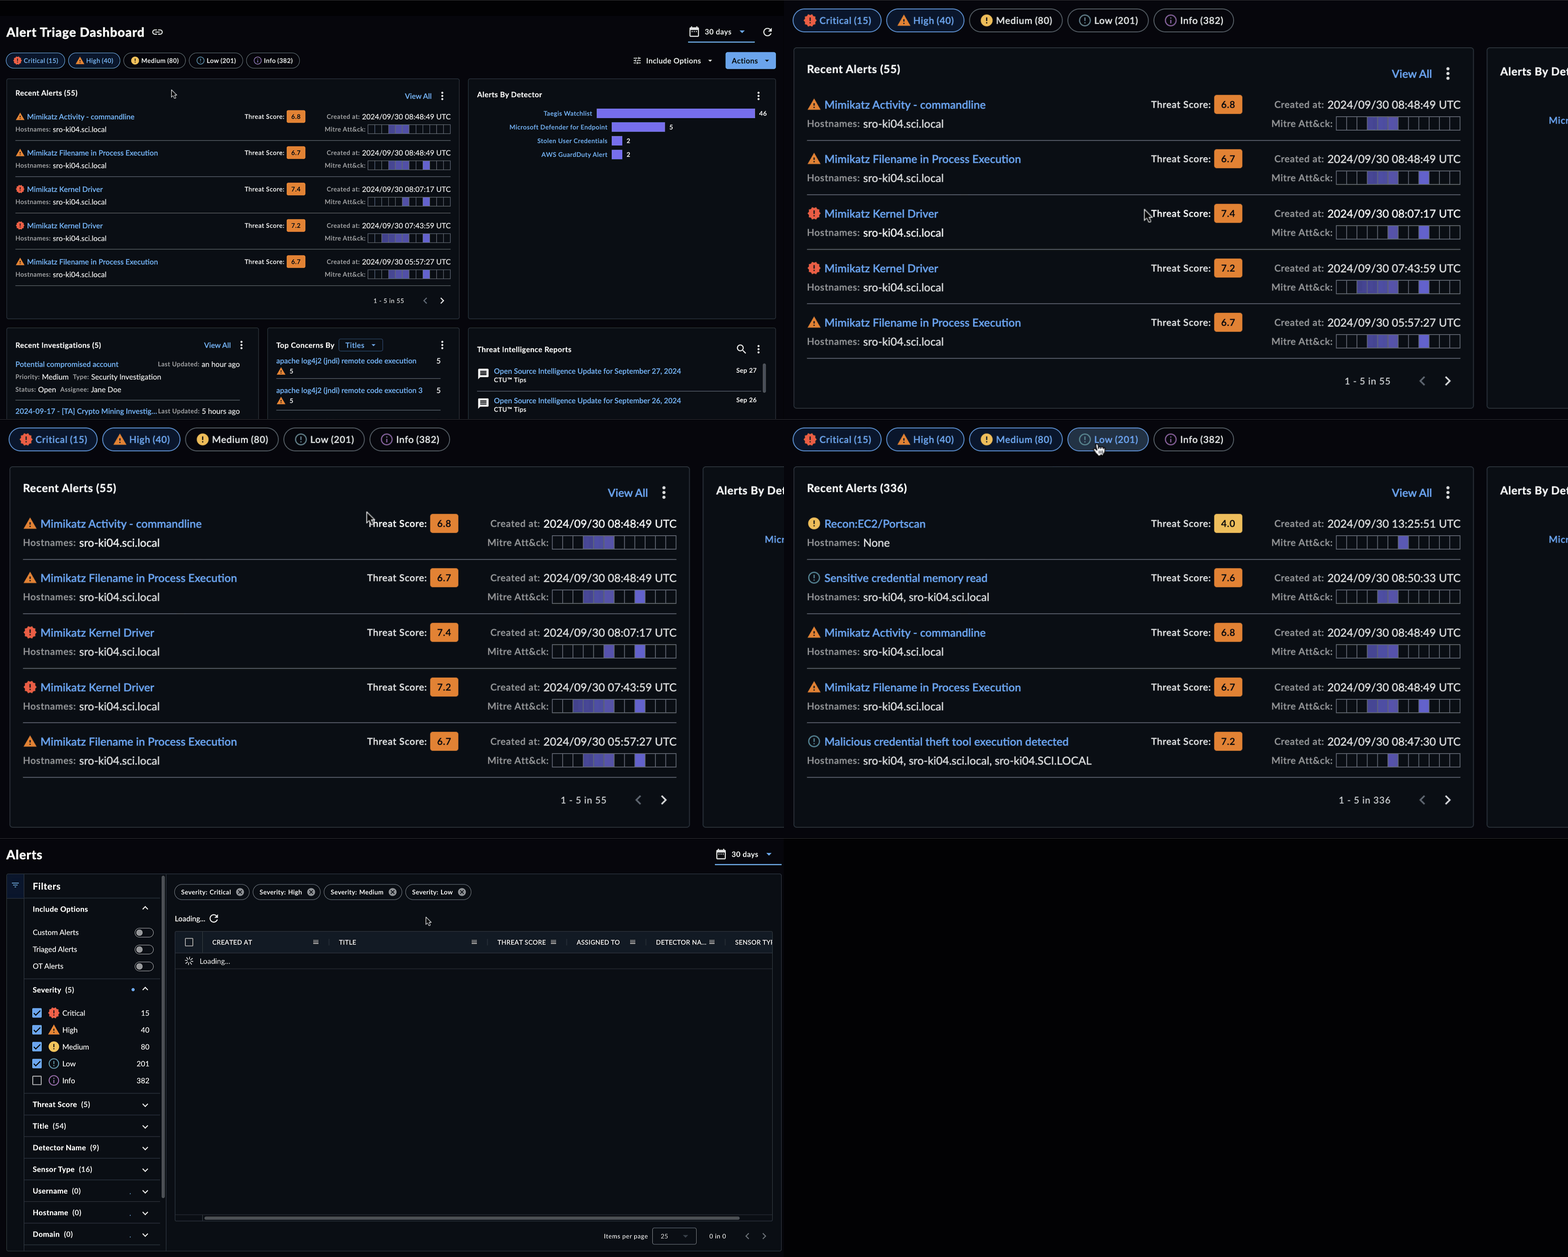
- Select any detection to open that detection’s details page.
- The top five matching detections are displayed. Page through to view more, or choose View All to see the entire matching list on the Detections page.
- Matching detections are filtered according to the dashboard settings, such as severity, time range, and whether custom detections are included.
- Detections are sorted from newest to oldest.
- Once detections are either added to a case or resolved, they are removed from the widget.
- Refresh the page for the latest information.
Detections by Detector🔗
The Detections By Detector widget gives you a quick overview of incoming detections sorted by detector. This enables you to evaluate detections from the perspective of detections inflowing from Secureworks® Taegis™ XDR and third-party sources.
Tip
The Detections By Detector widget gives you an easy-to-understand view of the various detections coming in from both XDR Detectors and any third-party detection sources you have configured. It allows you to see detection activity by detector to help you be aware of activity trends.
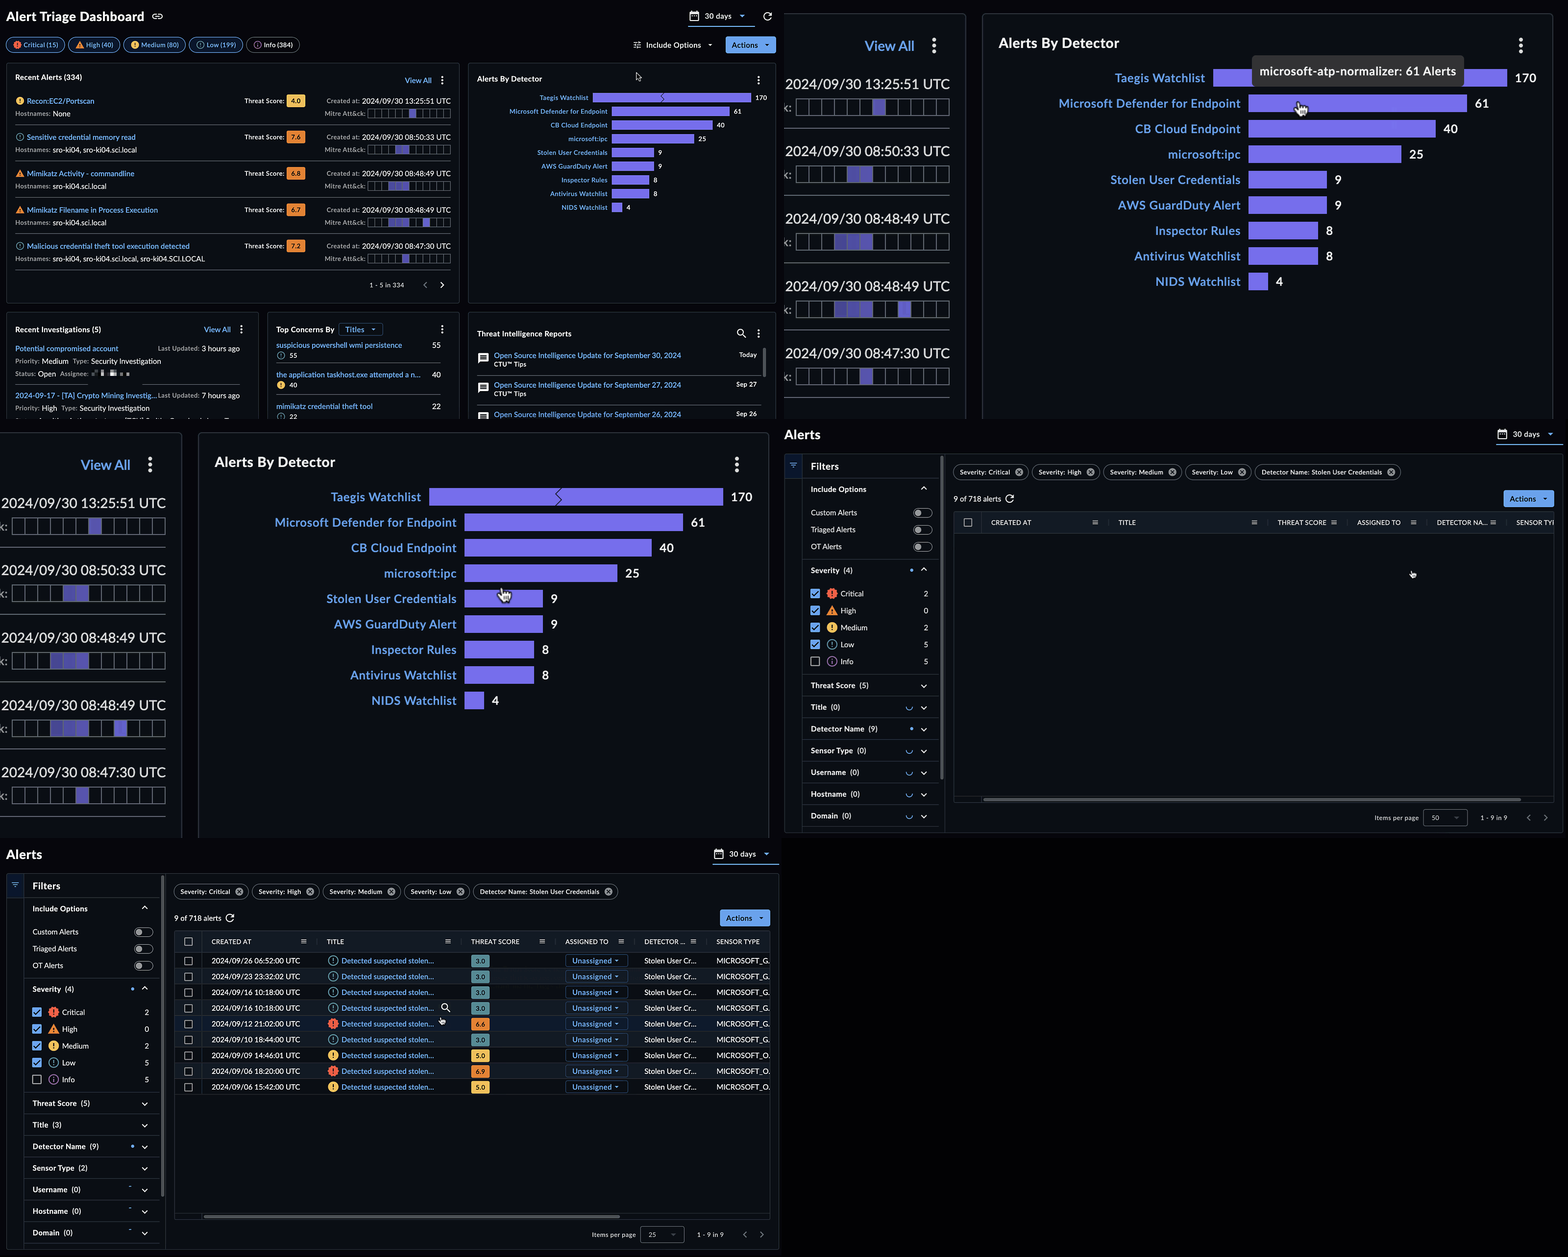
- Looking for detections that match your custom rules? Make sure you select Custom Detections within the Include Options dashboard setting.
- Detectors with a large number of detections compared to others may be displayed with a broken bar to indicate that the bar is not to scale (as shown in the following Taegis Watchlist entry).
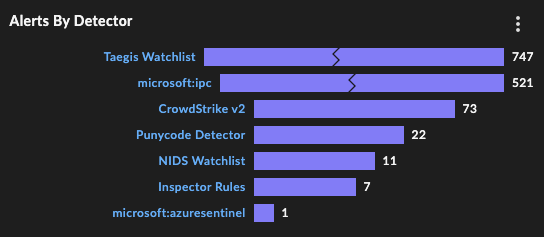
- Detectors are listed in order of most to least matching detections generated.
Recent Cases🔗
The Recent Cases widget lists the five most recently active in-progress cases. In addition to the case name, the widget displays the priority, type, status, assignee, and when each case was last updated.
Tip
The Recent Cases widget gives you a place to access your ongoing cases, so you can get back to where you were working, hop over to an active case, or view all cases.
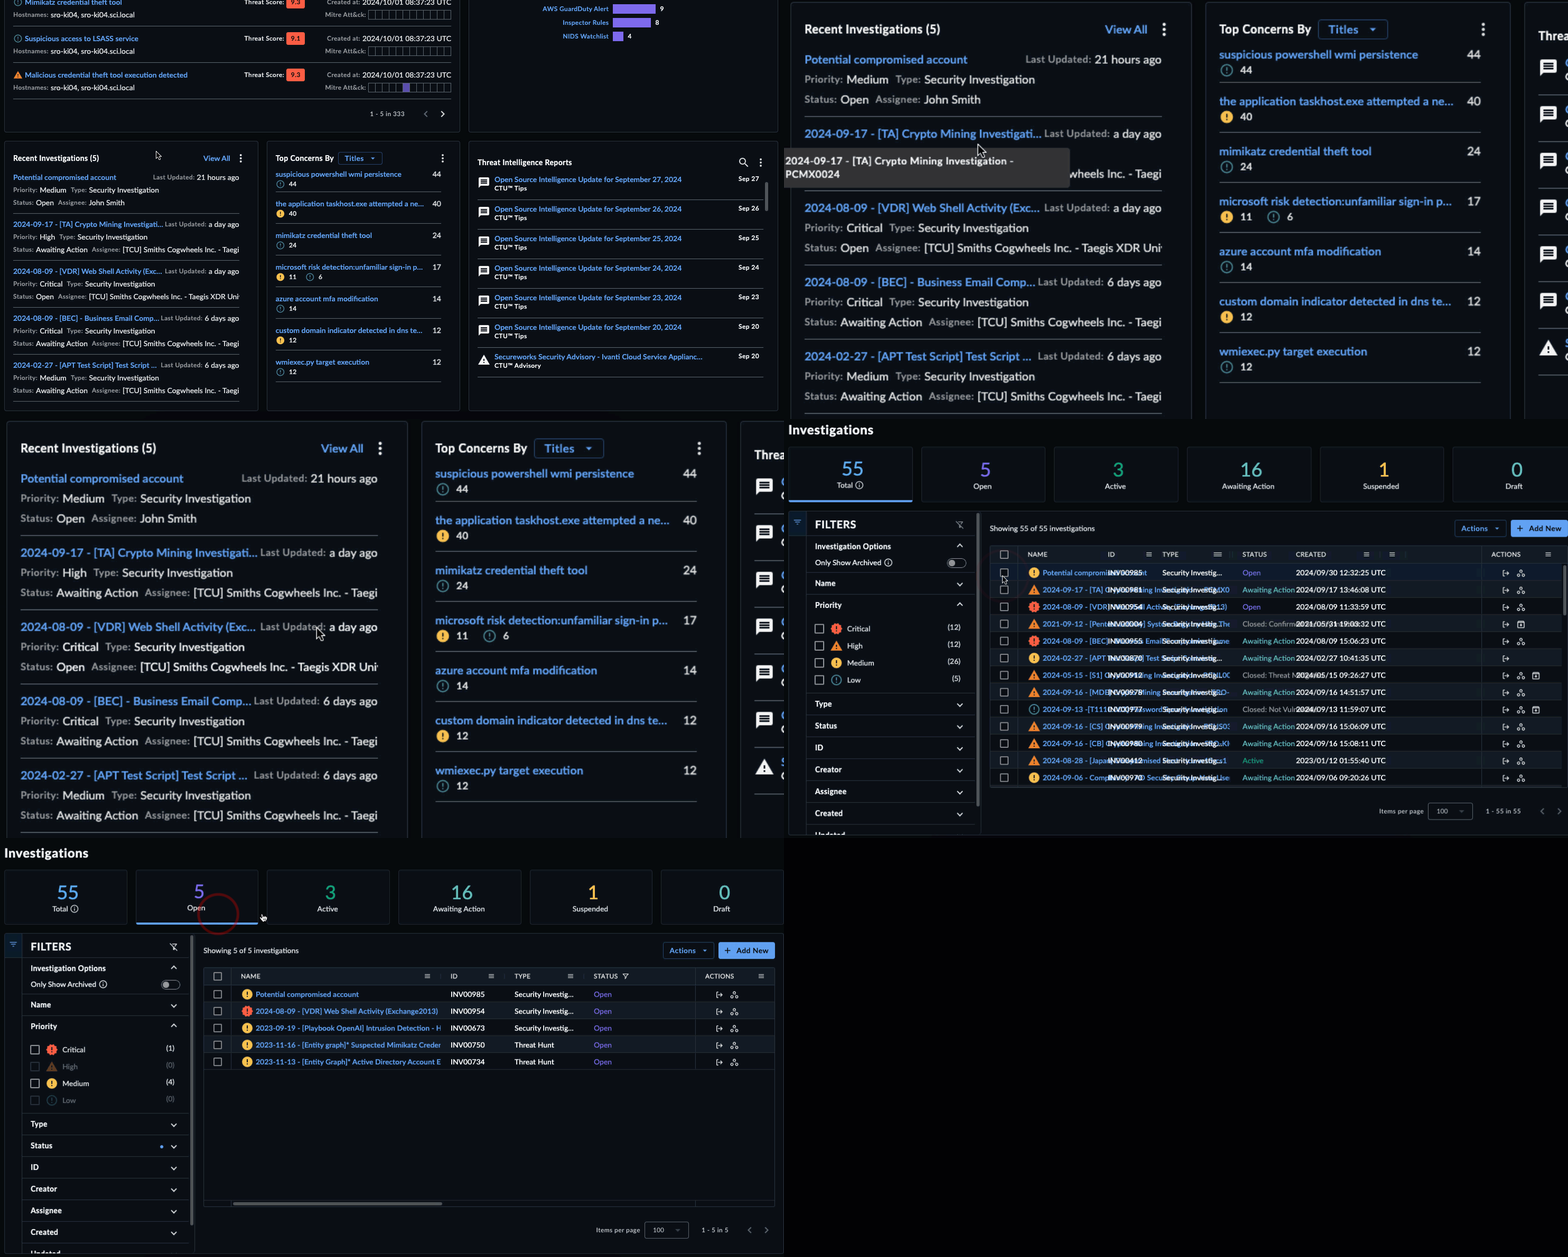
- Select any case to open that case’s details page.
- The top five most recent cases are displayed. Choose View All to see the entire matching list on the Cases page.
Top Concerns🔗
The Top Concerns widget displays a list of users, domains, hosts, or titles with the most detections. Select one of these options from the drop-down to view matching results. Each list is sorted by the number of related detections.
Tip
The Top Concerns widget enables you to review detection data as it pertains to the related entity (user, domain, host, or title watchlist). Grouping detections by these related entities enables you to focus on detections currently impacting a particular target.
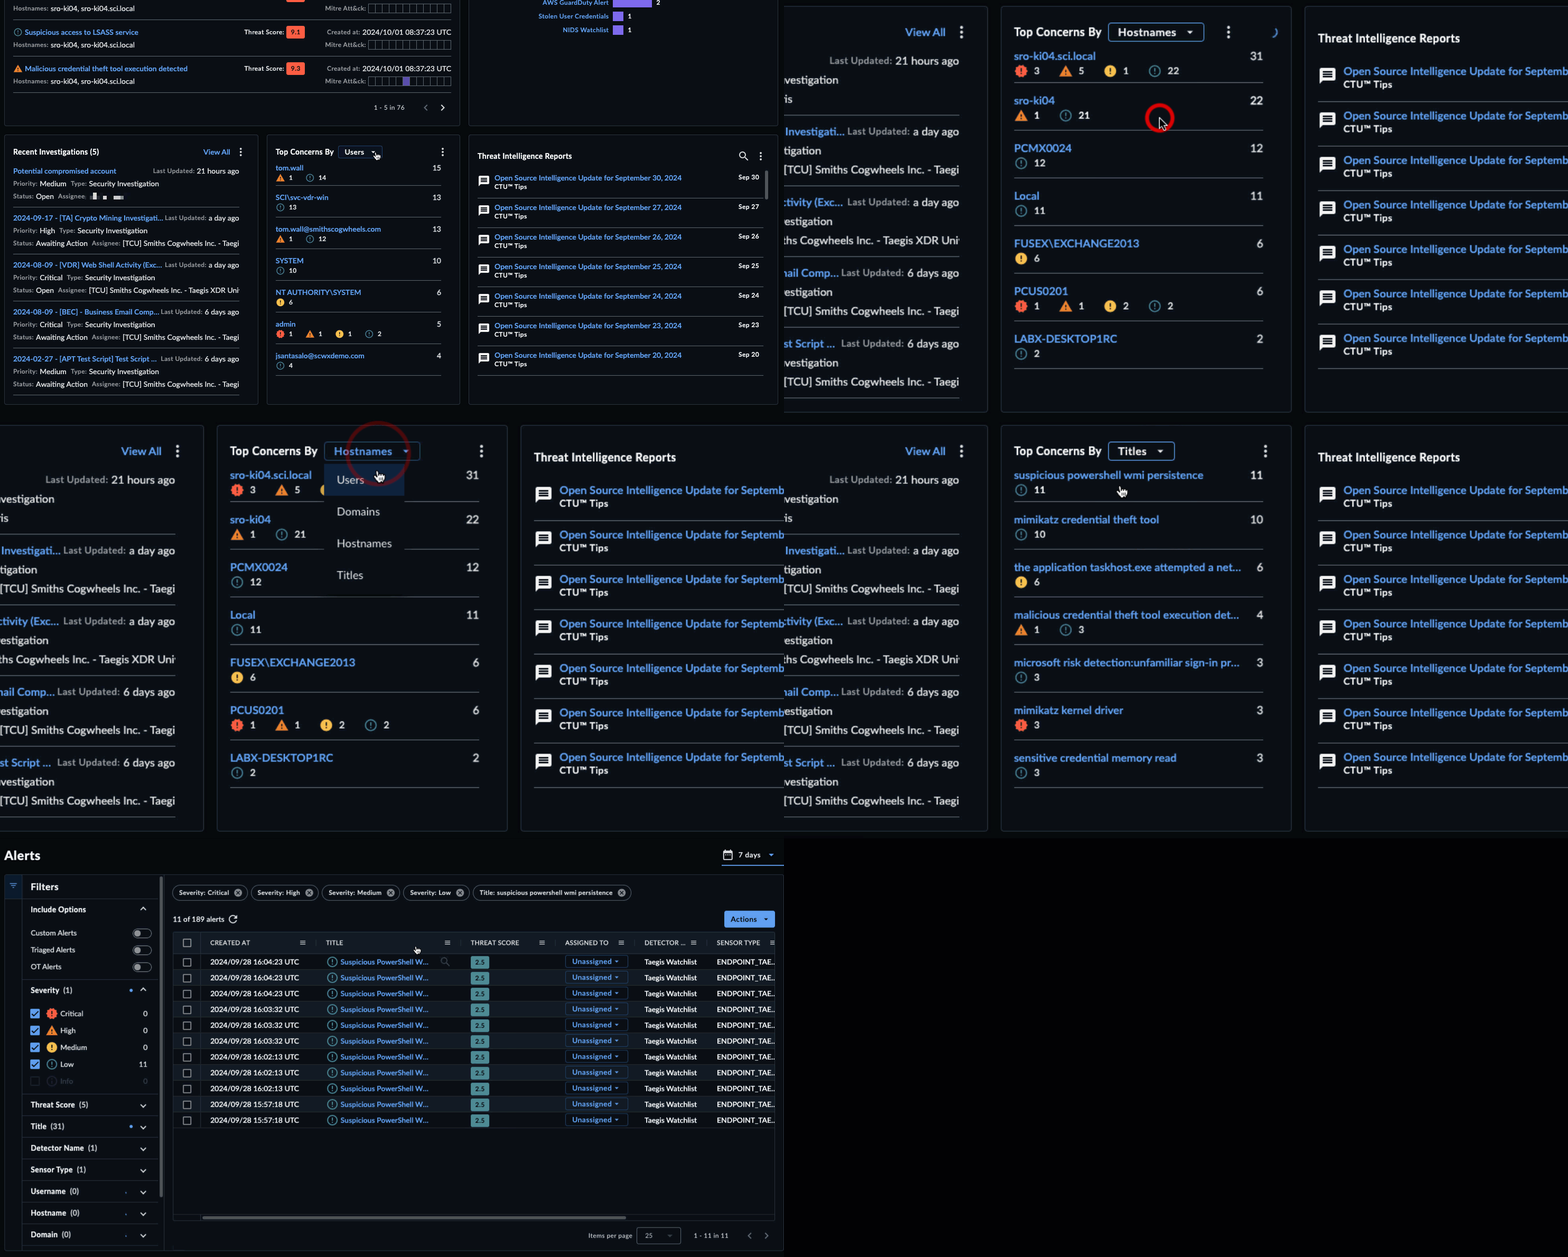
- Use the drop-down menu to refresh the widget with a matching list.
- Choose an item in the list to load a table of relevant detections on the Detections page.
- Each entity in the list includes a breakdown of the number of detections by severity, as well as the total number of detections.
Threat Intelligence Reports🔗
The Threat Intelligence Reports widget provides a list of the latest CTU™ Threat Intelligence Reports, with a search function that allows you to filter for specific topics or items.
Tip
The Threat Intelligence Reports widget allows you to stay up to date on the Threat Landscape as observed by Secureworks Security Researchers.


- Loads the most recent 50 published Intelligence Reports.
- Supports infinite scroll, which allows you to continuously scroll back in time for previously published reports.
- Allows searching through Intelligence Reports for topics of interest or indicators related to those topics.
- Launch a Pivot Search from an Indicator within an Intelligence Report and search the last 30 days of Detections and Events
- See the following topics for more information about:
Export Options🔗
Export Dashboard to PNG🔗
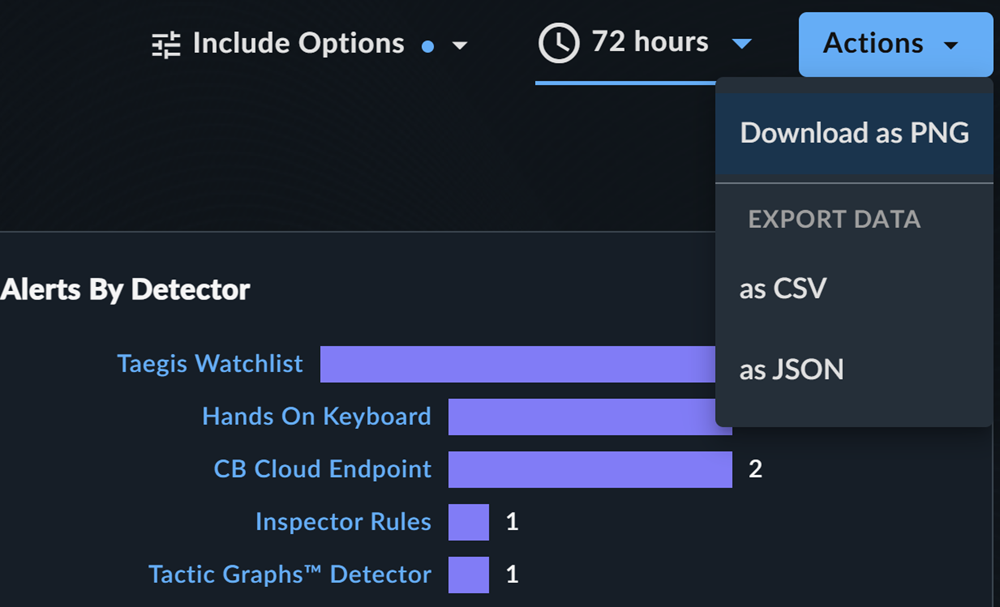
To export the entire dashboard to a PNG image file, select Actions from the top right of the dashboard and choose Download as PNG. The file automatically downloads.
Export Dashboard Data🔗
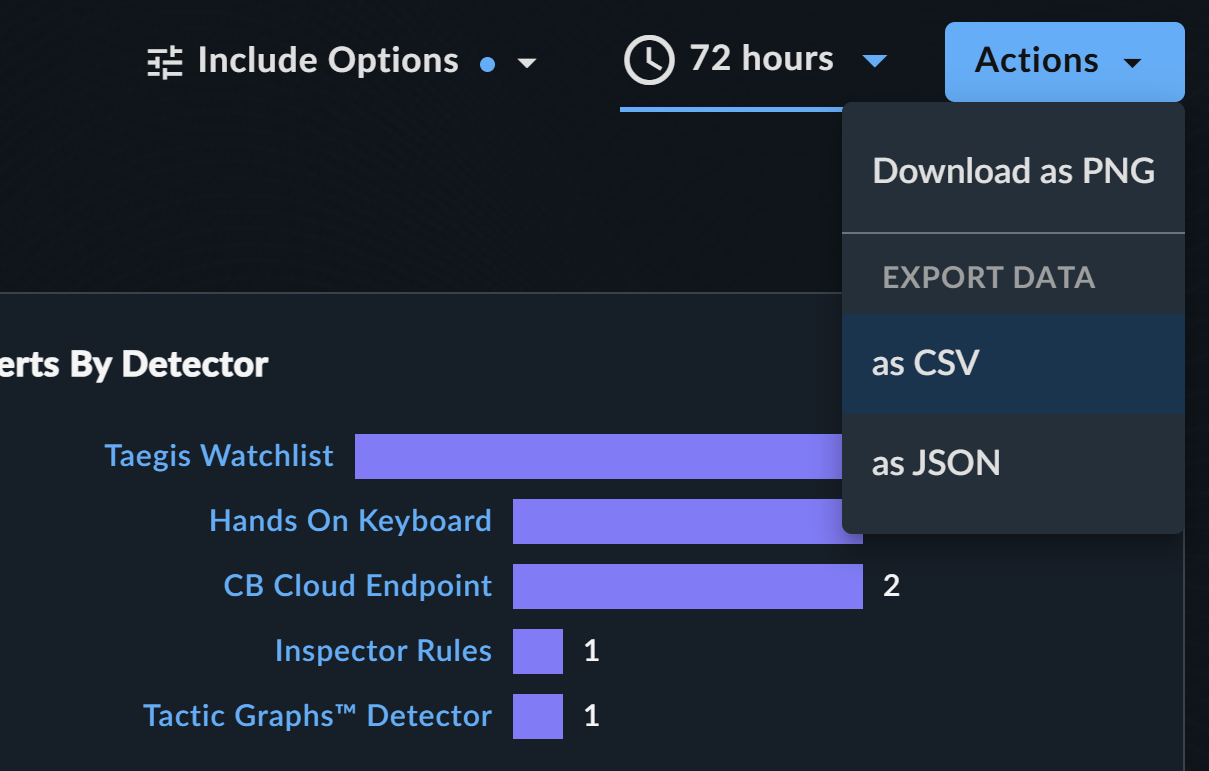
To export all data from the dashboard to a CSV or JSON file, select Actions from the top right of the dashboard and choose the Export Data CSV or JSON option.
Export Widgets to PNG🔗
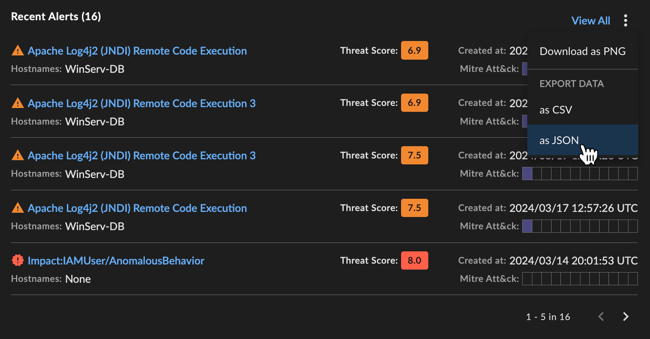
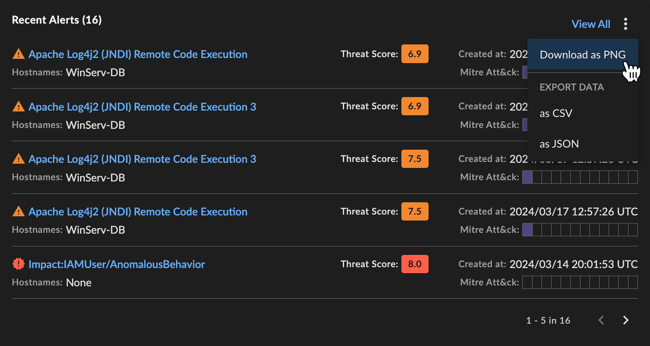
To export an individual widget to a PNG image file, select the vertical ellipsis from the top right of the desired widget and choose Download as PNG. The file automatically downloads.
Export Widget Data🔗
To export widget data as a CSV or JSON file, select the vertical ellipsis from the top right of the desired widget and choose the Export Data CSV or JSON option.
