Related Detections and Events Timeline View🔗
Note
The terms Alerts and Investigations have recently been changed to Detections and Cases in Taegis XDR. You may still see references to the old terms while we continue to work towards platform convergence of Sophos and Taegis technologies. For more information, see Taegis Terminology Updates.
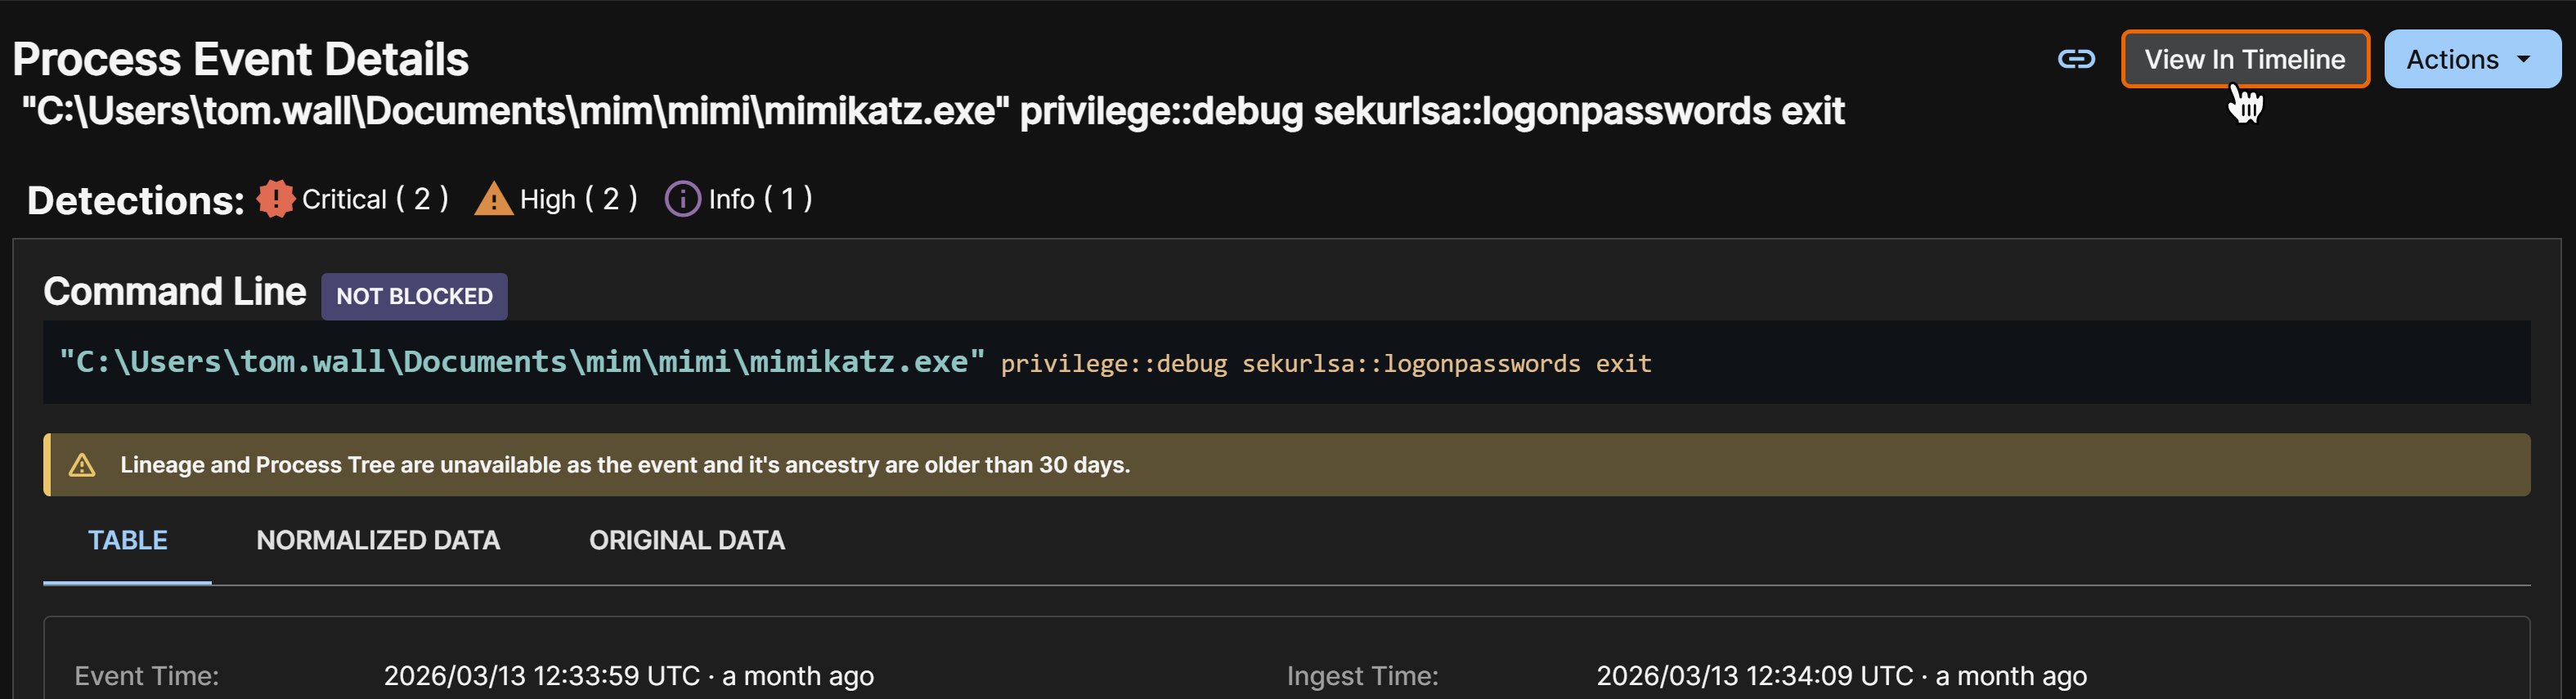
Certain event details pages include a View in Timeline option, which opens the Timeline of Related Detections & Events page with a Detections tab and Events tab. Each tab shows a filterable table of the detections and events related to the selected event.
To view the Timeline of Related Detections & Events, click View in Timeline from the top of certain event details pages.
Update the Search Timeframe🔗
You can update the search window of the Timeline of Related Detections & Events.
- From the Timeline of Related Detections & Events page, grab the handles of the timeline bar surrounding the source event and drag them to the time before or after you want to search.
- Click Update. Secureworks® Taegis™ XDR updates the detections and events for that window in the tables.
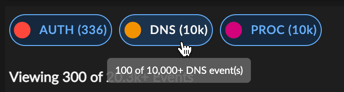
Filter by Event Type🔗
The Events tab includes filters for available data types above the table. Click a filter to include or exclude those event types from the table.
Timeline of Related Detections & Events Table Actions🔗
The tables of detections and events include the following actions that you can take:
- Add, remove, and reorder columns
- Export results to CSV
- Add to a new or existing case
Note
Column preferences are auto-saved to your XDR user profile.