Data Usage🔗
The Data Usage page provides a visualization of your data usage during the current billing cycle and how much each host consumes.
Note
Data usage is calculated daily at midnight Eastern Time. The data shown is current as of the previous day.
To view your data usage:
-
From the Taegis Menu, select Tenant Settings → Data Usage.
-
The Data Usage page appears.
Current Data Usage🔗
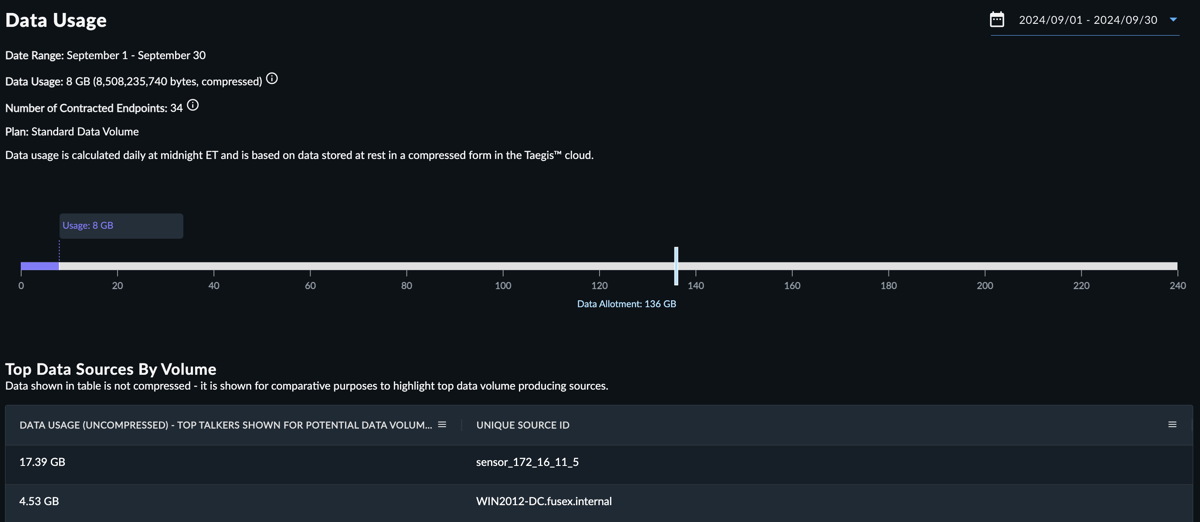
The first section displays the current data usage, which represents compressed data storage for the current month to date. Note that this value is calculated daily, so there will be a delay from the time data is ingested into XDR and when this page is updated.
Data Volume🔗
The second section displays the current data plan, including the total month-to-date data volume usage and the monthly data volume subscription allowance. The standard data volume subscription allows for no more than 4 GB of data stored multiplied by the licensed volume. An upgraded data volume subscription can be purchased.
Note
Exceeding your data volume allowance will not result in a loss of data; however, you may be required to upgrade your data volume subscription.
Top Data Sources by Volume🔗
The last section on the page shows the top data sources in terms of ingestion for the time period. The data shown in this table is primarily intended to show relative data volumes among sources, so that users can prioritize any configuration tuning efforts to reduce the volume of data produced, if needed. The data shown in this table is in uncompressed form, and the total will not correspond to the compressed total data stored shown above.
Note that these sources could represent endpoints or syslog sources. They will always display in descending order, meaning the highest volume producing source will always be listed first, followed by the next highest data producing source, etc. If the top sources by volume are syslog sources and their volumes seem excessively high, consider configuration tuning for the syslog data to potentially reduce the volume of data being sent into XDR.
Important
The table is derived from a daily process that identifies the top 100 data sources based on uncompressed data volume. This data is aggregated over the selected time period to provide an overview of leading sources by volume. Note that this table is designed to highlight the most significant sources, not to list all sources by data volume. As such, the table may not display every endpoint or data source reporting during the period.