Taegis MDR Dashboard🔗
Note
The terms Alerts and Investigations have recently been changed to Detections and Cases in Taegis XDR. You may still see references to the old terms while we continue to work towards platform convergence of Sophos and Taegis technologies. For more information, see Taegis Terminology Updates.
The Secureworks® Taegis™ MDR Dashboard features several widgets that enable security managers to:
- Monitor the work conducted by Secureworks on their behalf
- Understand the value that Secureworks provides
- Summarize and report on that value to their CISO
Accessing the Dashboard🔗
To access the Taegis MDR Dashboard, open Dashboards from the Taegis Menu and select Taegis MDR.
Only users using a tenant with a Taegis MDR subscription are able to view the Taegis MDR Dashboard.
Edit the Taegis MDR Dashboard using the following tips.
Edit Dashboard Settings🔗
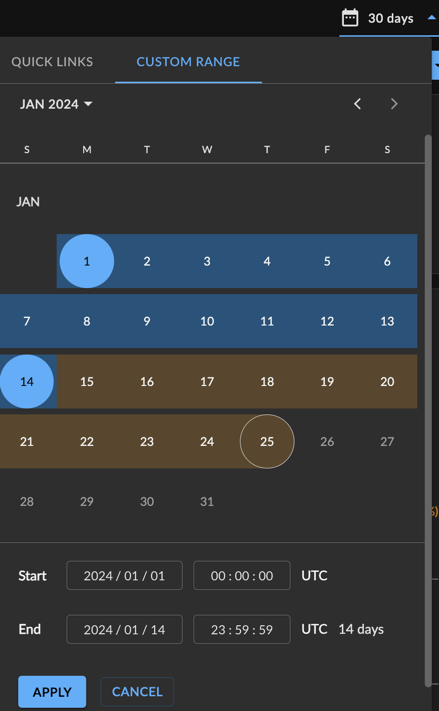
Date/Time🔗
The Taegis MDR Dashboard uses master date/time settings, which change the time period of all widgets at the same time.
Change the time period using the drop-down date/time picker at the top right of the dashboard. The default time period is 72 Hours, but choosing a custom time period overwrites it. The most recent time period selected becomes the new default.
Note
Detections may be searched for any time period.
However, event data is treated differently and can be searched for any period of 31 days or less in duration. Event data can be queried either from Advanced Search by choosing any non-detection Type or from Quick Search. When using either of these ways to query event data, a custom date picker allows you to specify a search time range. From this custom date picker, you can select any start date for which the account may have retained data. But when selecting the end date for the search time range, note that the number of days in the range (the difference between the start and end date) must be less than or equal to 31 days.
Trend Lines vs. Percentages🔗
Several widgets display percentages and trend lines. The percentage compares the selected time period to the previous time period. The trend line provides additional context by depicting the selected time period plus the previous three time periods.
For example, if the time scope for the Event Pipeline widget is Last 72 Hours, the number compares to the 3 days prior, and the trend line depicts the last 12 days.
| Negative Anomaly | No Anomaly | Positive Anomaly |
|---|---|---|
 |
 |
 |
| The current value is beyond the established threshold (+/- 2 standard deviations) between this period and the last period, and those changes are negatively anomalous. | The current value is within the established threshold (+/- 2 standard deviations) between this period and the last period, meaning there are no anomalies. | The current value is beyond the established threshold (+/- 2 standard deviations) between this period and the last period, and those changes are positively anomalous. |
Widgets🔗
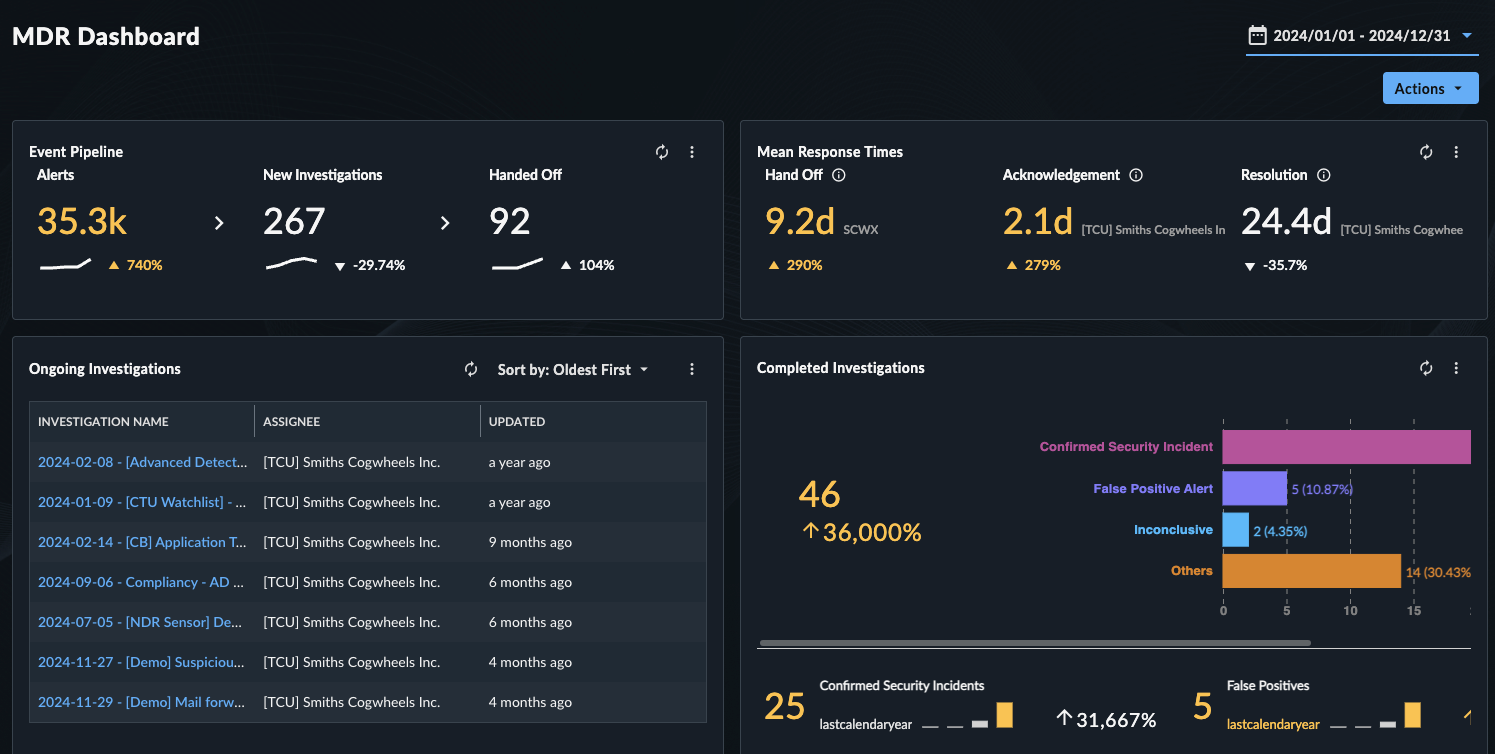
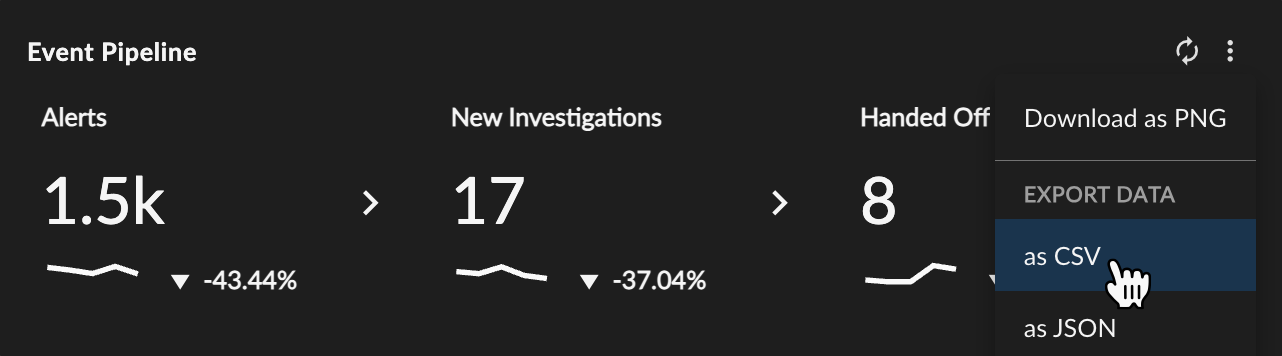
Event Pipeline🔗
The Event Pipeline widget highlights the breakdown of event filtering via Taegis MDR, through the following metrics:
- Detections — The number of detections triggered by raw events during the selected time period
- New Cases — The number of new cases created from those detections during the selected time period
- Handed Off — The number of those cases that were sent by Secureworks to your security team for further investigation or remediation during the selected time period, excluding Threat Hunt type cases

Below each metric is a percentage and a trend line, which compare the current time period being viewed to previous time periods. (See Trend Lines vs. Percentages to learn about what each represents.) Select one of the metrics to open up a side drawer with more detailed information about the detections or cases.
Export Data🔗
See Export Options for more information on exporting widget data.
Tip
You can also download a CSV of the side drawer data tables when you drill down into Taegis MDR Dashboard metrics.
Ongoing Cases🔗
The Ongoing Cases widget displays any case that is currently open, active, or awaiting action.

- Select any case to go to that case’s details.
- By default, this widget is sorted from oldest to newest cases.
- Edit the sort order as needed.
- The top five open cases that match the filters are displayed on the Taegis MDR Dashboard. Choose View All to see the entire matching list in a side drawer.
- Select the Refresh icon to reload the list.
Tip
Want to assign an ongoing case to someone? See Hand Off a Case.
Export Data🔗
See Export Options for more information on exporting widget data.
Tip
You can also download a CSV of the side drawer data tables when you drill down into Taegis MDR Dashboard metrics.
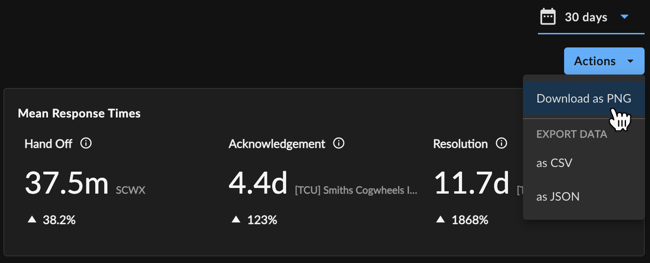
Mean Response Times🔗
The Mean Response Times widget highlights Taegis MDR’s impact on the timeliness of event handling, through the following three metrics:
- Hand Off — The mean amount of time elapsed from when a Secureworks analyst took ownership of a case to the initial handoff to your organization
- Acknowledge — The mean amount of time elapsed from when Secureworks initially handed off a case to when someone in your organization initially viewed it
- Resolution — The mean amount of time elapsed from when Secureworks initially handed off a case to the time the case is resolved. If a case has been reopened, the time is calculated from the initial handoff to the most recent resolution of that case.

Below each metric is a percentage that compares the current time period being viewed to previous time periods. (See Trend Lines vs. Percentages to learn about what each represents.) Select one of the metrics to open up a side drawer with more detailed information about the events, detections, or cases.
Scatter Chart🔗
Select one of the metrics to open up a side drawer with additional information. This includes a scatter chart which maps how the individual response times and mean response time correspond with the Service Level Agreement (SLA). Below the chart is a list of all matching cases or detections.
Some tips for reading the scatter chart:
- The X-axis displays the date of completion.
- The Y-axis displays the response time in minutes.
- Purple dots indicate detections or cases that met the SLA.
- Red dots indicate detections or cases that exceeded the SLA.
- Hover over a dot to view details about that specific case, such as when it was handed off and who is the assignee.
- A red line indicates the SLA.
- A solid black line indicates the mean response time for the currently displayed time period.
- A yellow line indicates the mean response time for the currently displayed time period, and it was anomalous (a significant increase over the last time period).
- Zoom in on any part of the time period by grabbing and dragging the handles of the scroll bar below the chart. Once zoomed in on any given area, you can click on the highlighted region and drag it to scroll through time.
- The list of matching cases or detections updates as you adjust the time period scroll bar.
Export Data🔗
See Export Options for more information on exporting widget data.
Tip
You can also download a CSV of the side drawer data tables when you drill down into Taegis MDR Dashboard metrics.
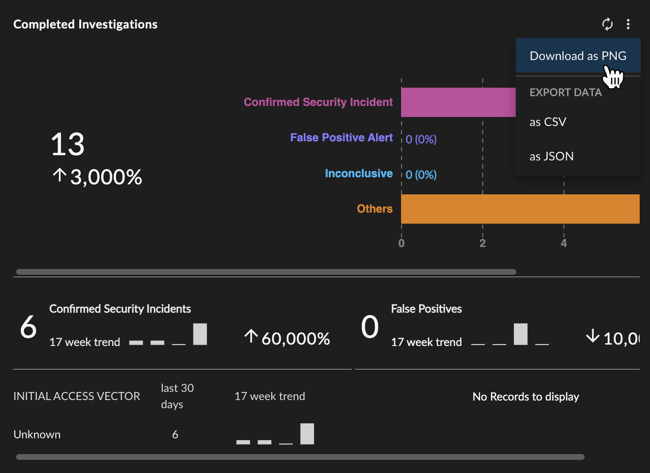
Completed Cases🔗
The Completed Cases widget displays the total number of completed cases for the selected time period, and a percentage comparing the selected time period to the previous time period. It also features a bar chart breaking down the cases into the following categories:
- False Positive — The number of cases with activity determined to be false positive and did not constitute security incidents.
- Confirmed Security Incidents — The number of cases that have been closed with a status of Confirmed Security Incident, providing an indication of how many cases required further actions to address a threat.
- Inconclusive — The number of cases where the activity’s root cause was not identified and no further activity was detected.
- Unknown — The number of cases that did not fall into one of the categories above. These may be older cases from before the current close codes were available in Secureworks® Taegis™ XDR.
Select one of the bars to open up a side drawer with a list of matching cases for that category, including their status.

Export Data🔗
See Export Options for more information on exporting widget data.
Tip
You can also download a CSV of the side drawer data tables when you drill down into Taegis MDR Dashboard metrics.
Note
Completed Cases also has two sub-widgets: Confirmed Security Incidents and False Positives.
Confirmed Security Incidents🔗
Confirmed Security Incidents is a sub-widget of Completed Cases that provides an overview of which resolved security incidents were most significant to your organization. It displays how many cases with the close code ’Confirmed Security Incidents’ there were in the selected time period, and what MITRE ATT&CK™ Initial Access Vector they map to, if available. It also displays a trend bar chart and percentage comparing the number of confirmed security incidents to the previous four time periods, both overall and per Initial Access Vector category.
Important
The large-sized number displays a count of cases with the close code ’Confirmed Security Incidents.’ Initial Access Vectors are not always associated with a case or may have multiple associations. As a result, the sum of these Initial Access Vectors may exceed or be less than the total number of ’Confirmed Security Incidents’ cases.
Initial Access Vector Information🔗
Select one of the Initial Access Vector metrics to open up a side drawer with more detailed information about the confirmed security incidents in that category. This includes a bar chart of the confirmed security incidents in the selected time period.
Some tips for reading this chart:
- The X-axis displays the date of the security incident.
- The Y-axis displays the number of security incidents.
- Hover over a bar to view the number of confirmed security incidents in that time period.
- A yellow or green bar indicates that the number of confirmed security incidents was anomalous compared to the previous time period. Hover over the bar to see the change in percentage.
- Zoom in on any part of the time period by grabbing and dragging the handles of the scroll bar below the chart.
- Once zoomed in on any given area, you can click on the highlighted region and drag it to scroll through time.
- The list of matching cases below the bar chart updates as you adjust the time period scroll bar. Select the title to open that case’s details page.
Export Data🔗
See Export Options for more information on exporting widget data.
Tip
You can also download a CSV of the side drawer data tables when you drill down into Taegis MDR Dashboard metrics.
False Positives🔗
False Positives is a sub-widget of Completed Cases that displays the number of false positives in the selected time period. A breakdown is provided by the detector that generated the genesis detection. It also displays a trend bar chart and percentage that compares the number of false positives to the previous three. The widget also displays a pie chart representation of the proportion of genesis detections by detector type for the current period.
Important
The large-sized number displays a count of cases with the close code ’False Positive.’ The number of detectors represented in the pie chart is calculated based on which genesis detections associated with the case are classified as ’False Positive.’ Because a case can have 1 to n number of genesis detections, the sum of these detectors may exceed or be less than the total number of ’False Positive’ cases.
Tip
See Trend Lines vs. Percentages to learn about the difference between the trend data and the percentage.
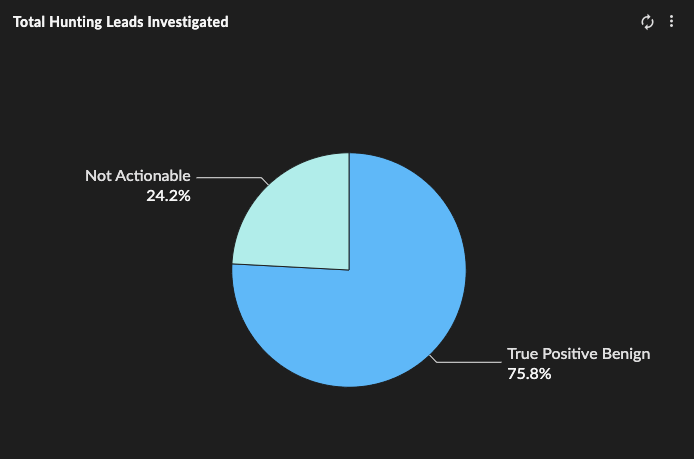
Total Hunting Leads Investigated (Elite Threat Hunting Only)🔗
Note
This widget is only available to Elite Threat Hunting customers.
The Total Hunting Leads Investigated widget displays a pie chart of all open detections that have been triaged during the selected time period, broken down according to their status:
- True Positive: Malicious — A confirmed security incident. Activity indicates that your organization's systems or data have been compromised or that measures put in place to protect them have failed.
- True Positive: Benign — Activity was correctly identified, but either it does not compromise the targeted system or data, or it has been mitigated.
- False Positive — Activity that is misidentified and non-malicious
- Not Actionable — The activity may be valid, but remediation actions may not be possible
Hover over a pie segment for the total count of each status.
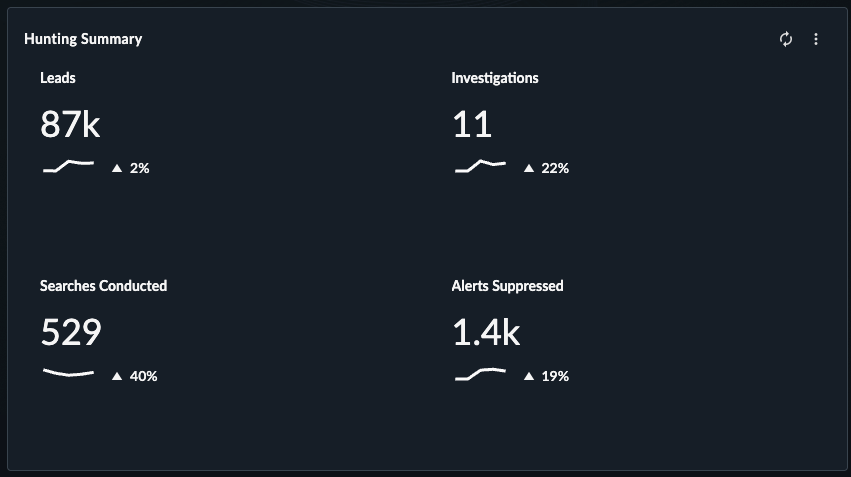
Hunting Summary (Elite Threat Hunting Only)🔗
Note
This widget is only available to Elite Threat Hunting customers.
The Hunting Summary widget displays counts of the following Threat Hunting metrics:
- Leads — The total count of low confidence events, or combination of events, that indicate potential malicious activity requiring further investigation
- Cases — The total count of cases categorized as Threat Hunt, Taegis MDR Threat Hunt, Elite Threat Hunting Threat Hunt, or CTU Threat Hunt
- Searches Conducted — The total number of searches conducted by Secureworks analysts
- Detections Suppressed — The total count of detections suppressed by detection suppression rules
Below each metric is a percentage and a trend line, which compare the current time period being viewed to previous time periods. (See Trend Lines vs. Percentages to learn about what each represents.)
Export Options🔗
Export Dashboard to PNG🔗
To export the entire dashboard to a PNG image file, select Actions from the top right of the dashboard and choose Download as PNG. The file automatically downloads.
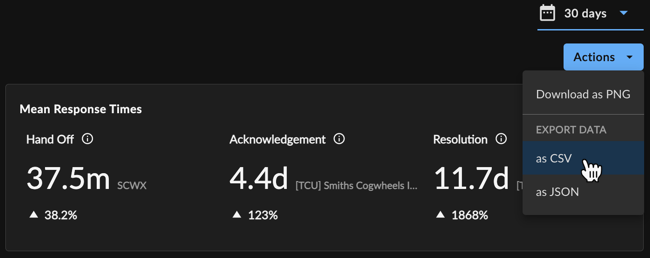
Export Dashboard Data🔗
To export all data from the dashboard to a CSV or JSON file, select Actions from the top right of the dashboard and choose the Export Data CSV or JSON option.
Export Widgets to PNG🔗
To export an individual widget to a PNG image file, select the vertical ellipsis from the top right of the desired widget and choose Download as PNG. The file automatically downloads.
Tip
You can also export the visuals resulting from drilling down into certain widgets to PNG.
Export Widget Data🔗
To export widget data as a CSV or JSON file, select the vertical ellipsis from the top right of the desired widget and choose the Export Data CSV or JSON option.
Export Table Data🔗
Download a CSV of the side drawer data tables when you drill down into Taegis MDR metrics:
- Select one of the metrics from a widget to open up a side drawer with more detailed information.
- Open the Actions menu and select Export All as CSV or as JSON to download all of the table’s data.
- Or, use the checkmarks to select individual rows. Then open the Actions menu and select Export Selected as CSV or as JSON.