Playbook Executions🔗
There are two ways to view the history of a playbook’s executions: on the Executions overview tab, and on a configured playbook details page.
Tip
You can also view an overview of all recent executions on Automations Overview.
Playbook Executions Tab🔗
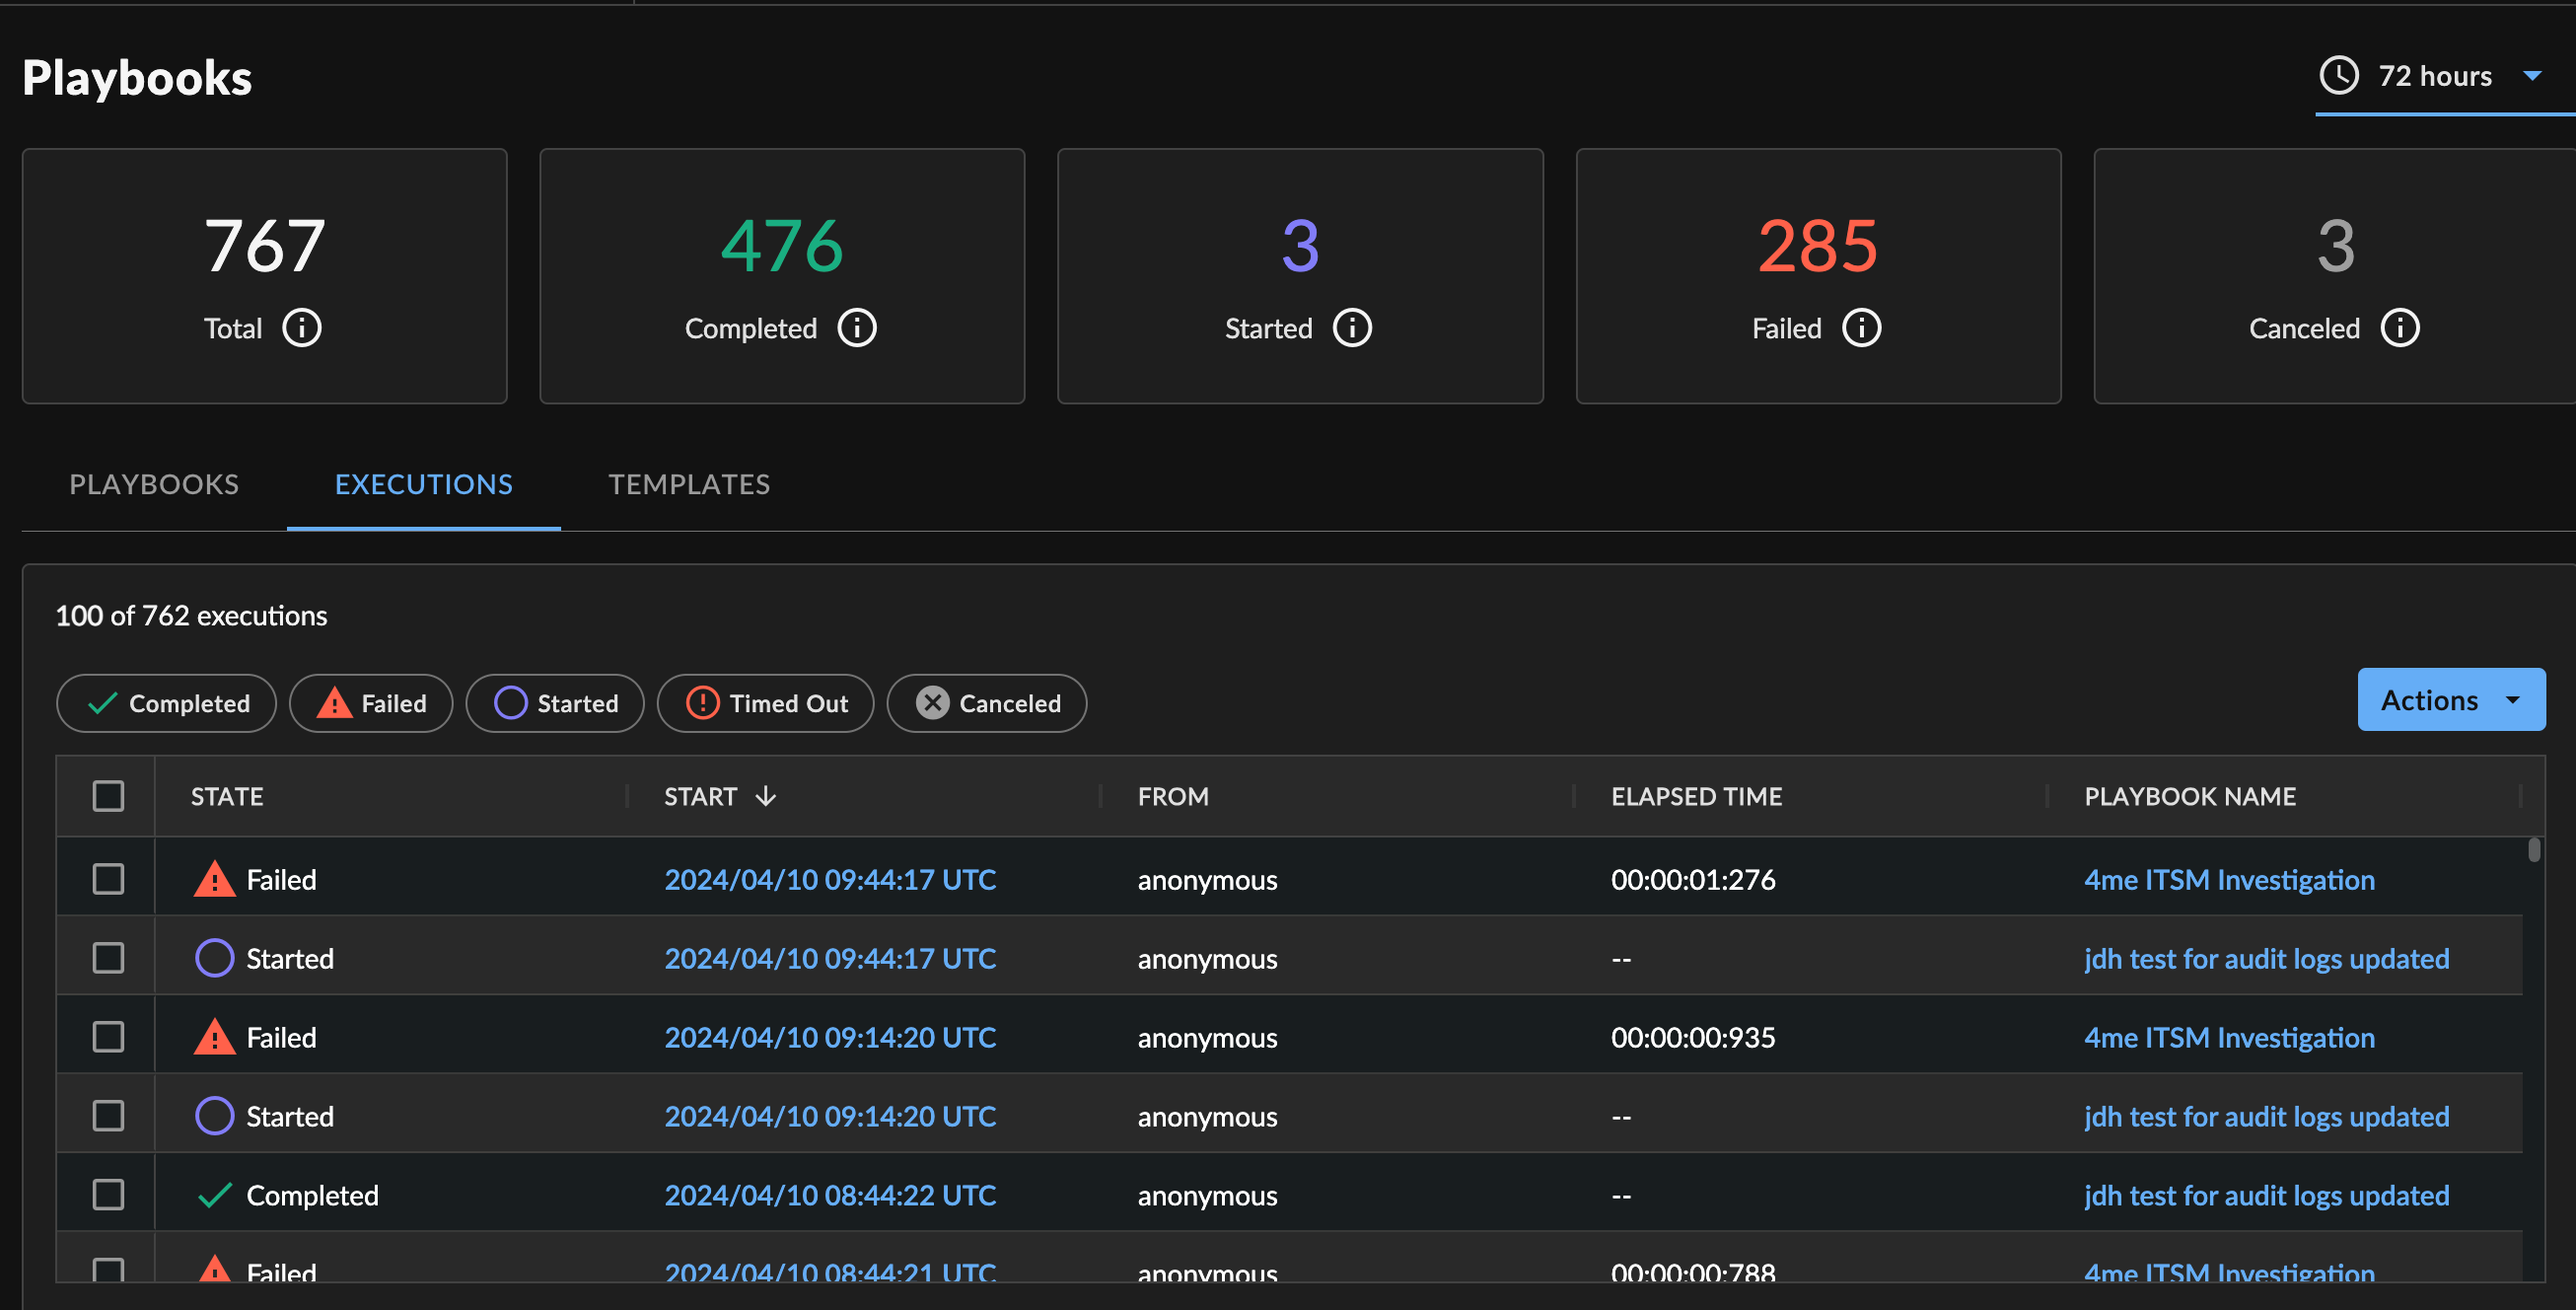
The Executions tab shows all executed playbooks.
Tip
Use the expandable Filters menu at the left of the table and the State column to quickly identify executions in various states.
Playbook Details Executions🔗
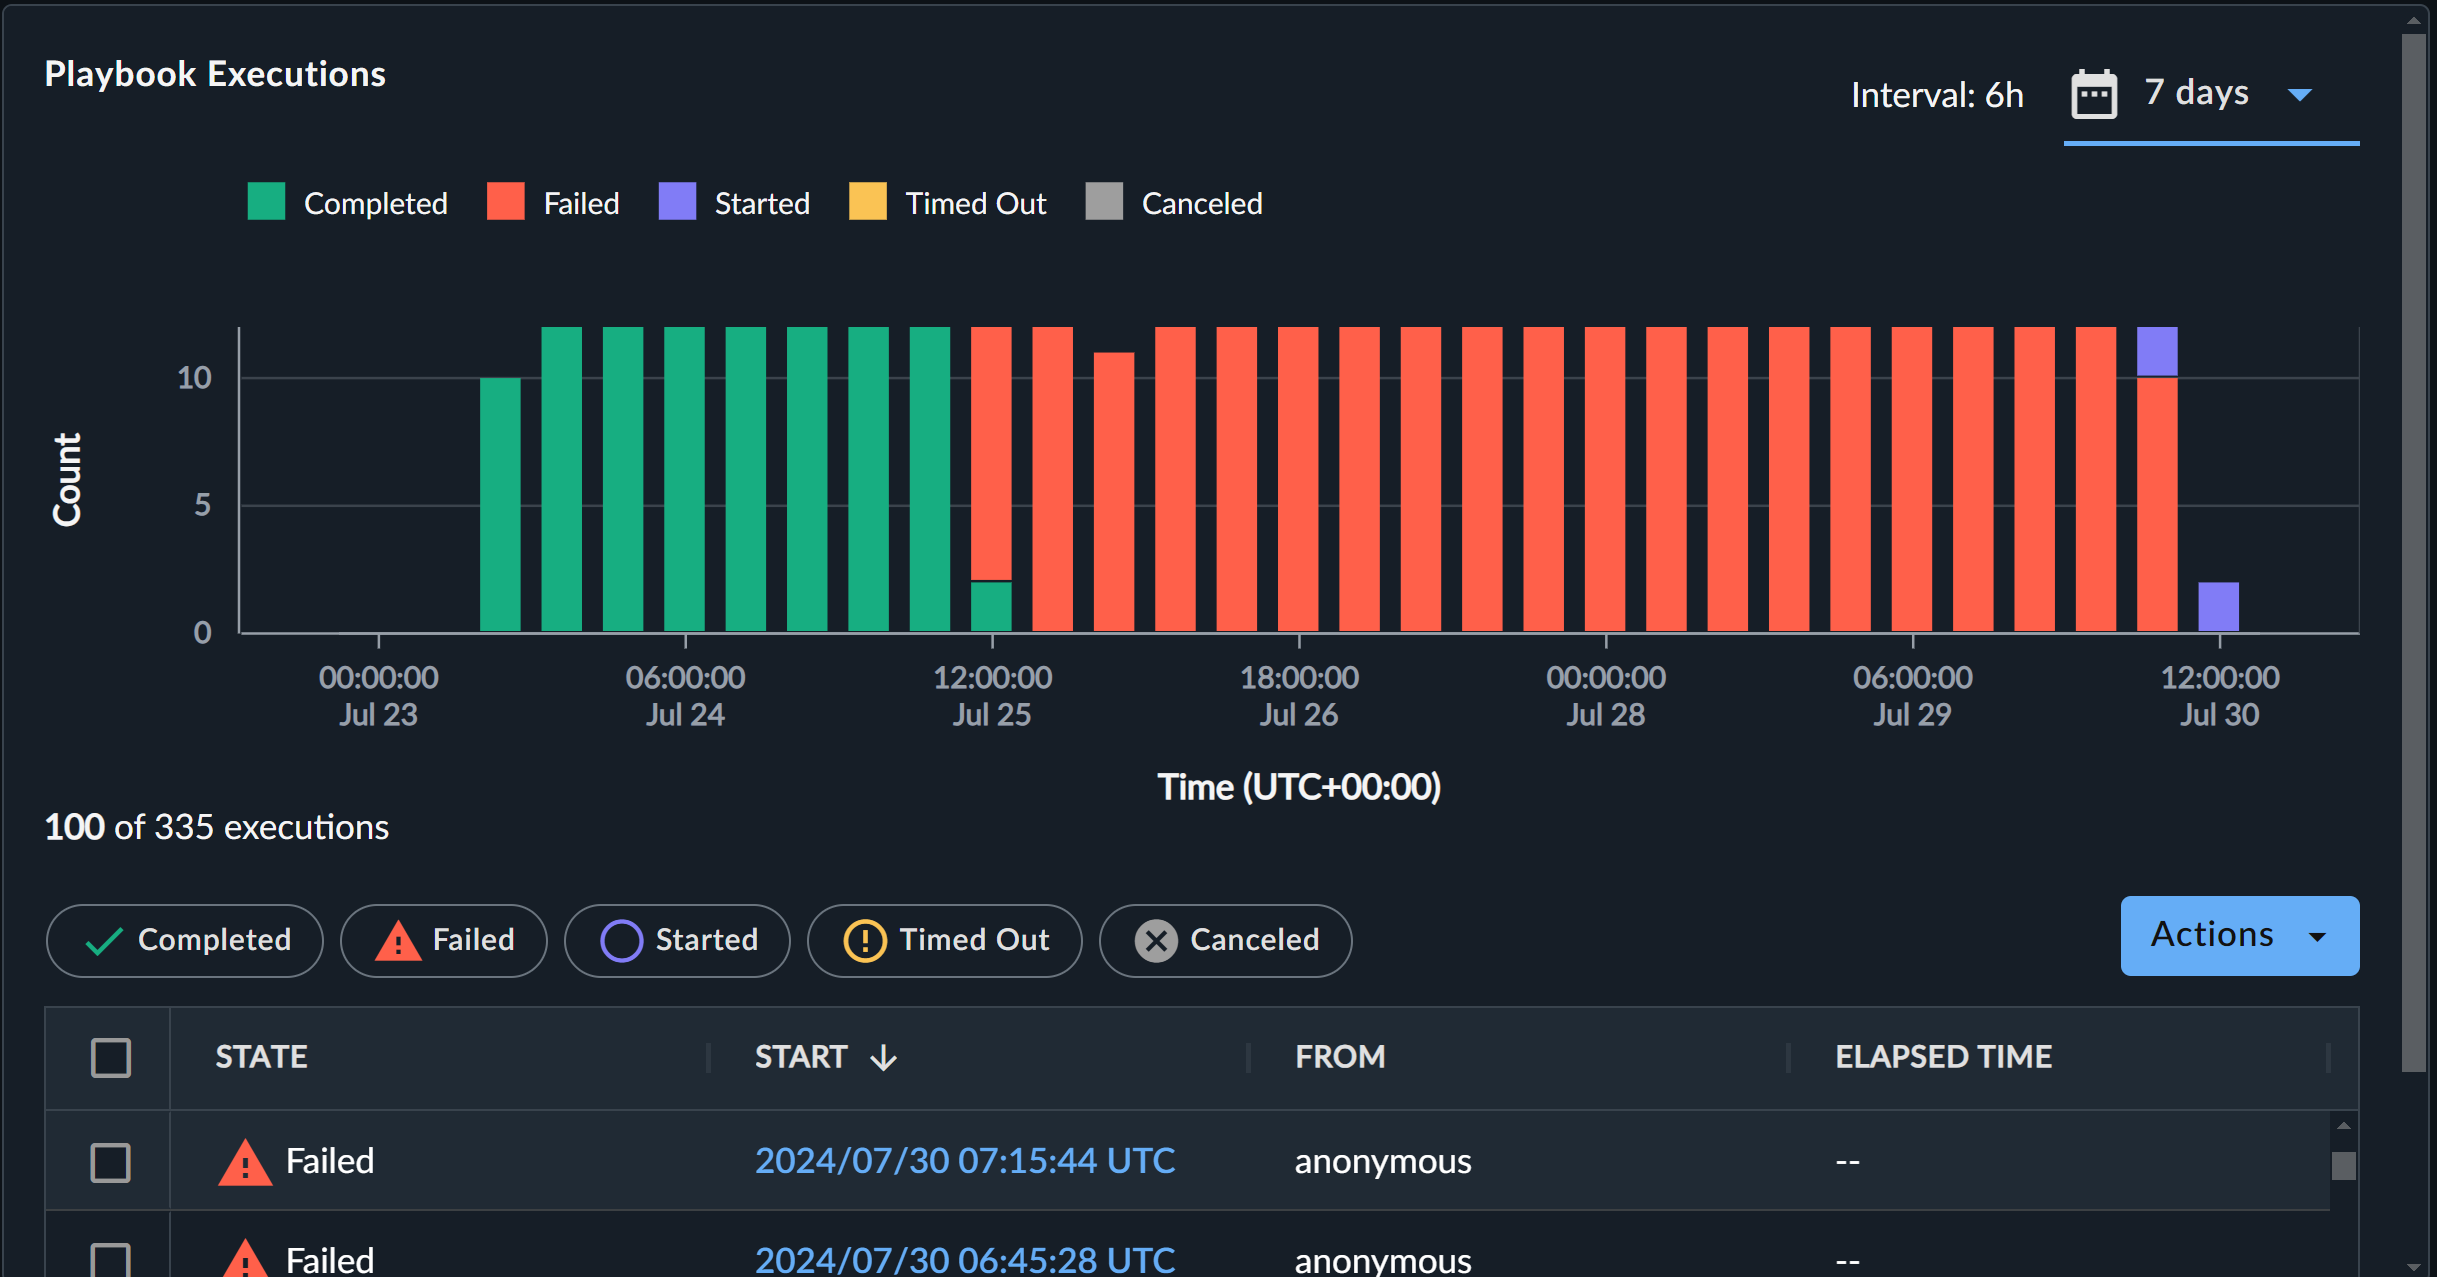
Configured playbook details pages have a Playbook Executions section with a table of all executions of the playbook.
Tip
Select one or more filters above the table to quickly identify executions in various states.
Possible playbook states include:
- Completed: The playbook executed without any errors.
- Failed: The playbook failed to complete because of an error.
- Started: The playbook is currently running.
- Canceled: The playbook was manually canceled before it finished running.
Note
The playbook state reports whether the playbook execution finished, while the outcome reports whether the playbook execution achieved its intended result. Hover over the outcome to see a tooltip with details.
Friendly History Field Names🔗
Automation and APIs play a crucial role in the Taegis platform by streamlining processes and eliminating repetitive tasks.
When records are modified within the Taegis platform by configured Automation playbooks rather than a logged-in user, the change details are captured as friendly identity names in the Created By and Updated By fields to represent Automation actions.
Specific names are used for various platform actions:
- Automatic Case (Investigation): These are cases created by or appended to by the Automatic Case engine. They can result from rules executed by a provider on behalf of their sub-tenants or within each tenant based on tenant-level rules.
- Automatic Evidence Sync: This label applies whenever the platform bulk-appends detection and event data to a case.
- Automation: Refers to changes made by playbooks and connectors running within the Taegis platform.
- Taegis MDR: Encompasses automation and scripting leveraged in the delivery of our Secureworks® Taegis™ MDR services.
View Playbook Executions and Failures🔗
Open a configured playbook details page to see a history of its executions in a bar graph. Adjust the time frame as needed.
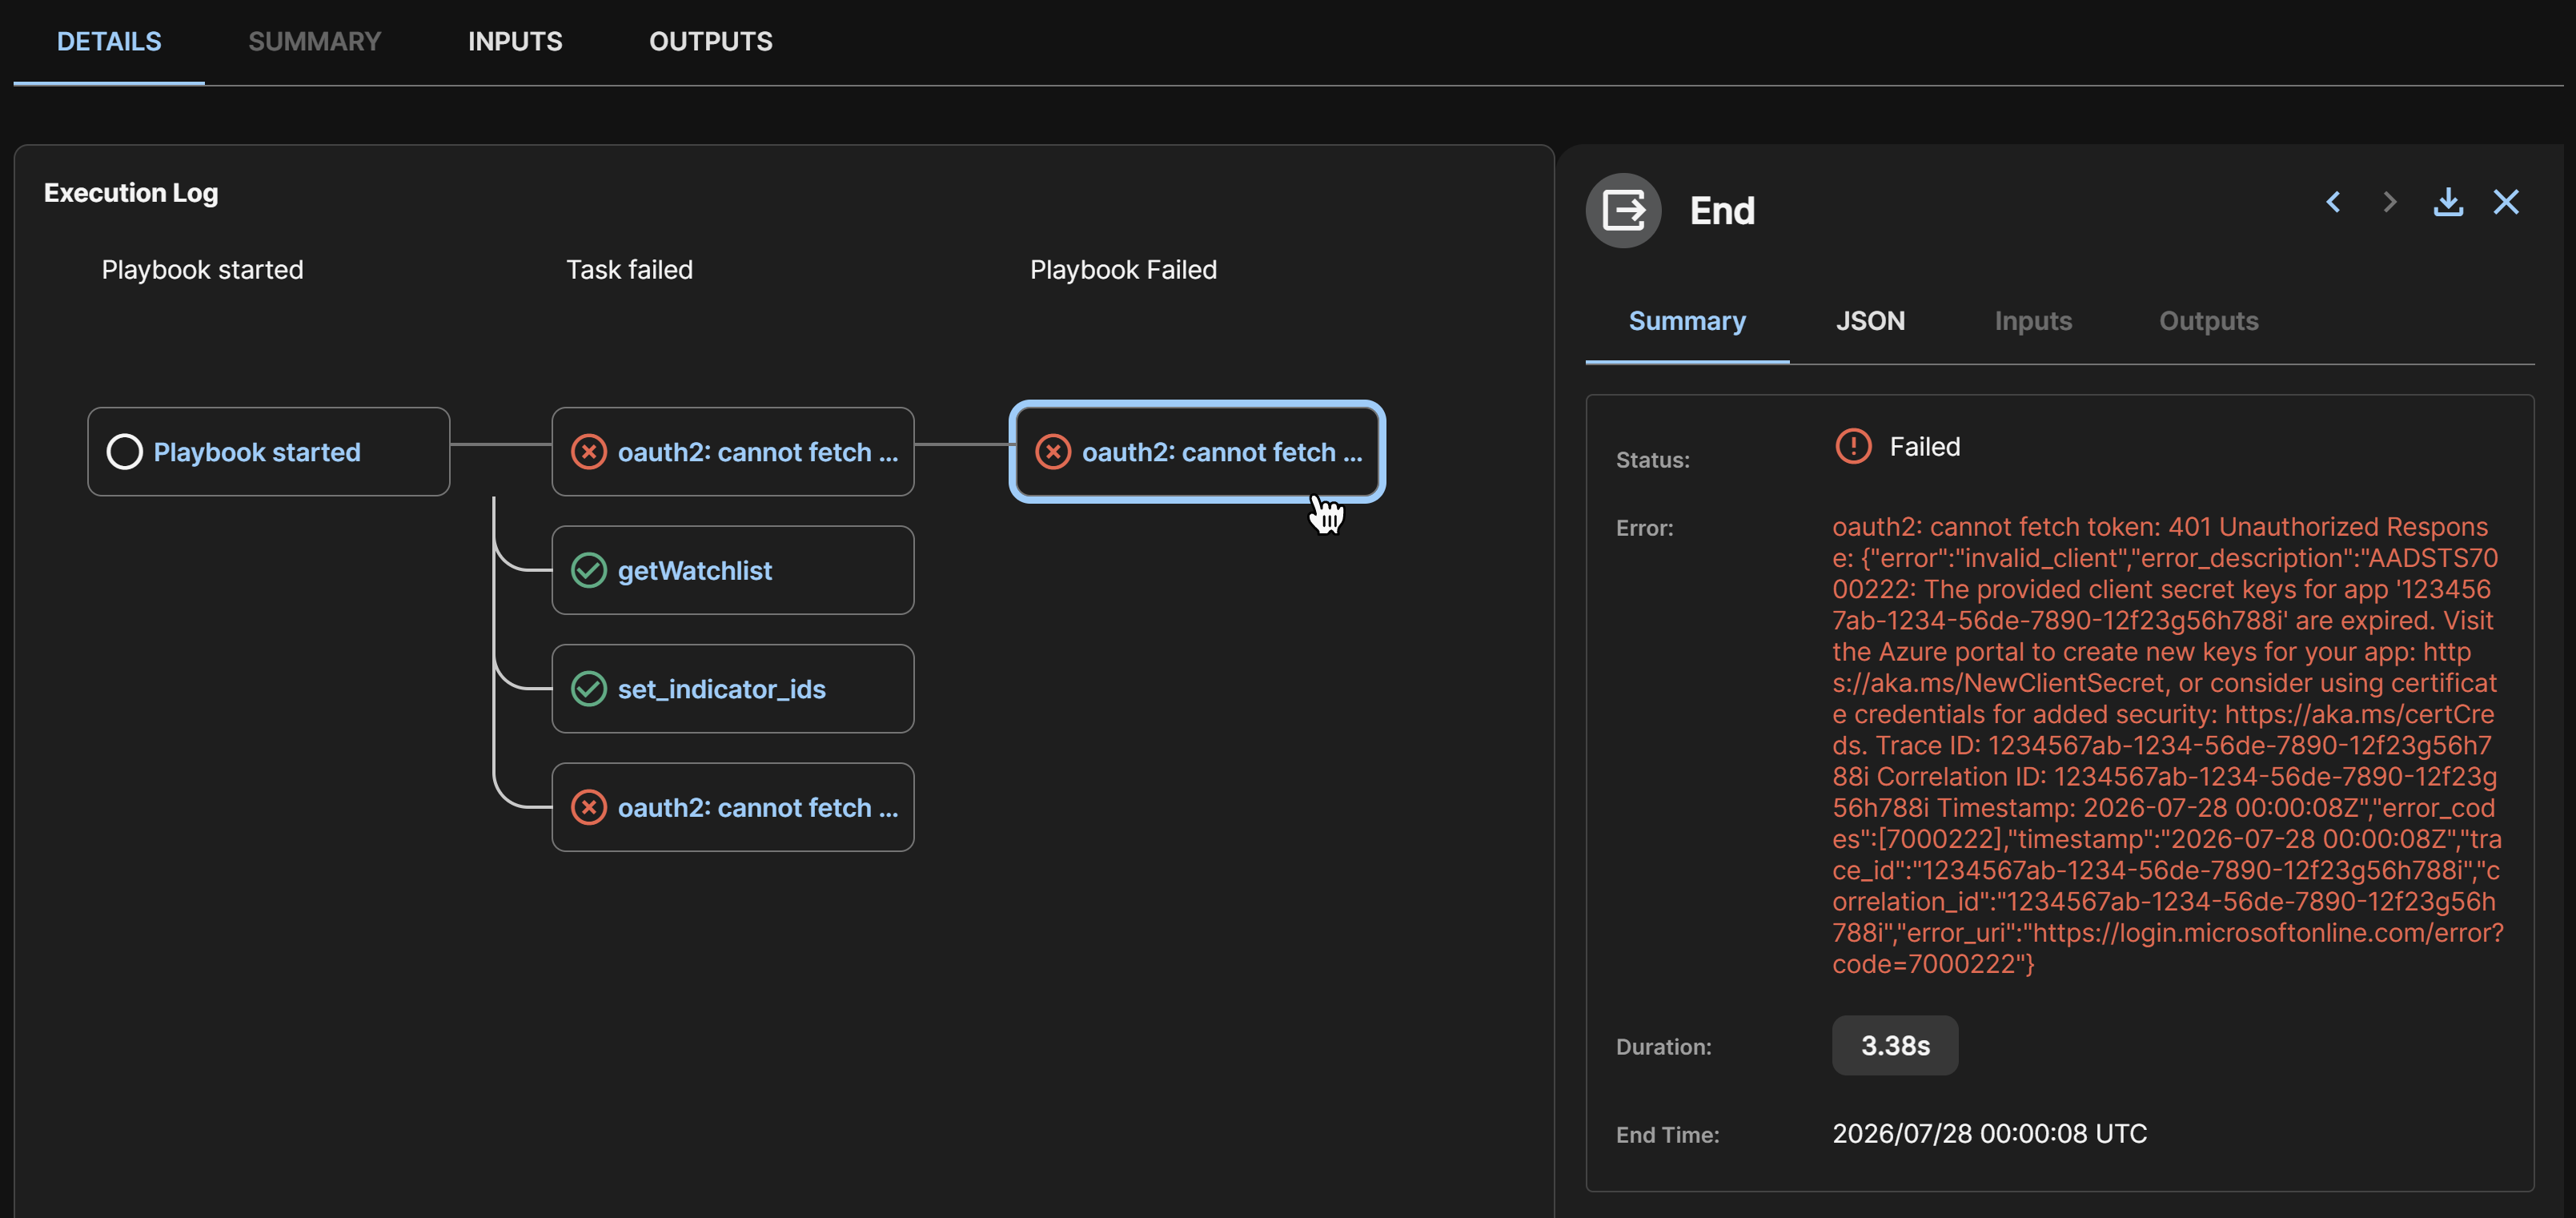
Below the graph is a table that lists a full record of the playbook’s past executions. Select the start time of one of these executions to open a slide-out that has a summary of the execution and JSONs of the inputs and outputs.
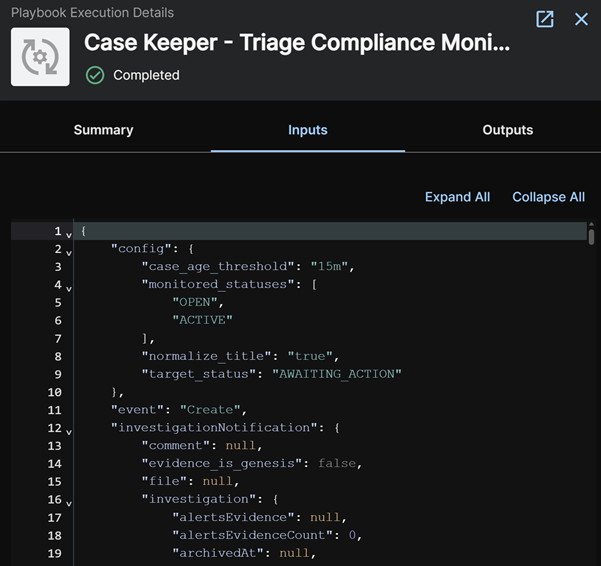
Click the New Tab icon to open the full execution details where you can drill down into individual steps and identify where a playbook failed to execute.
Cancel Playbook Executions🔗
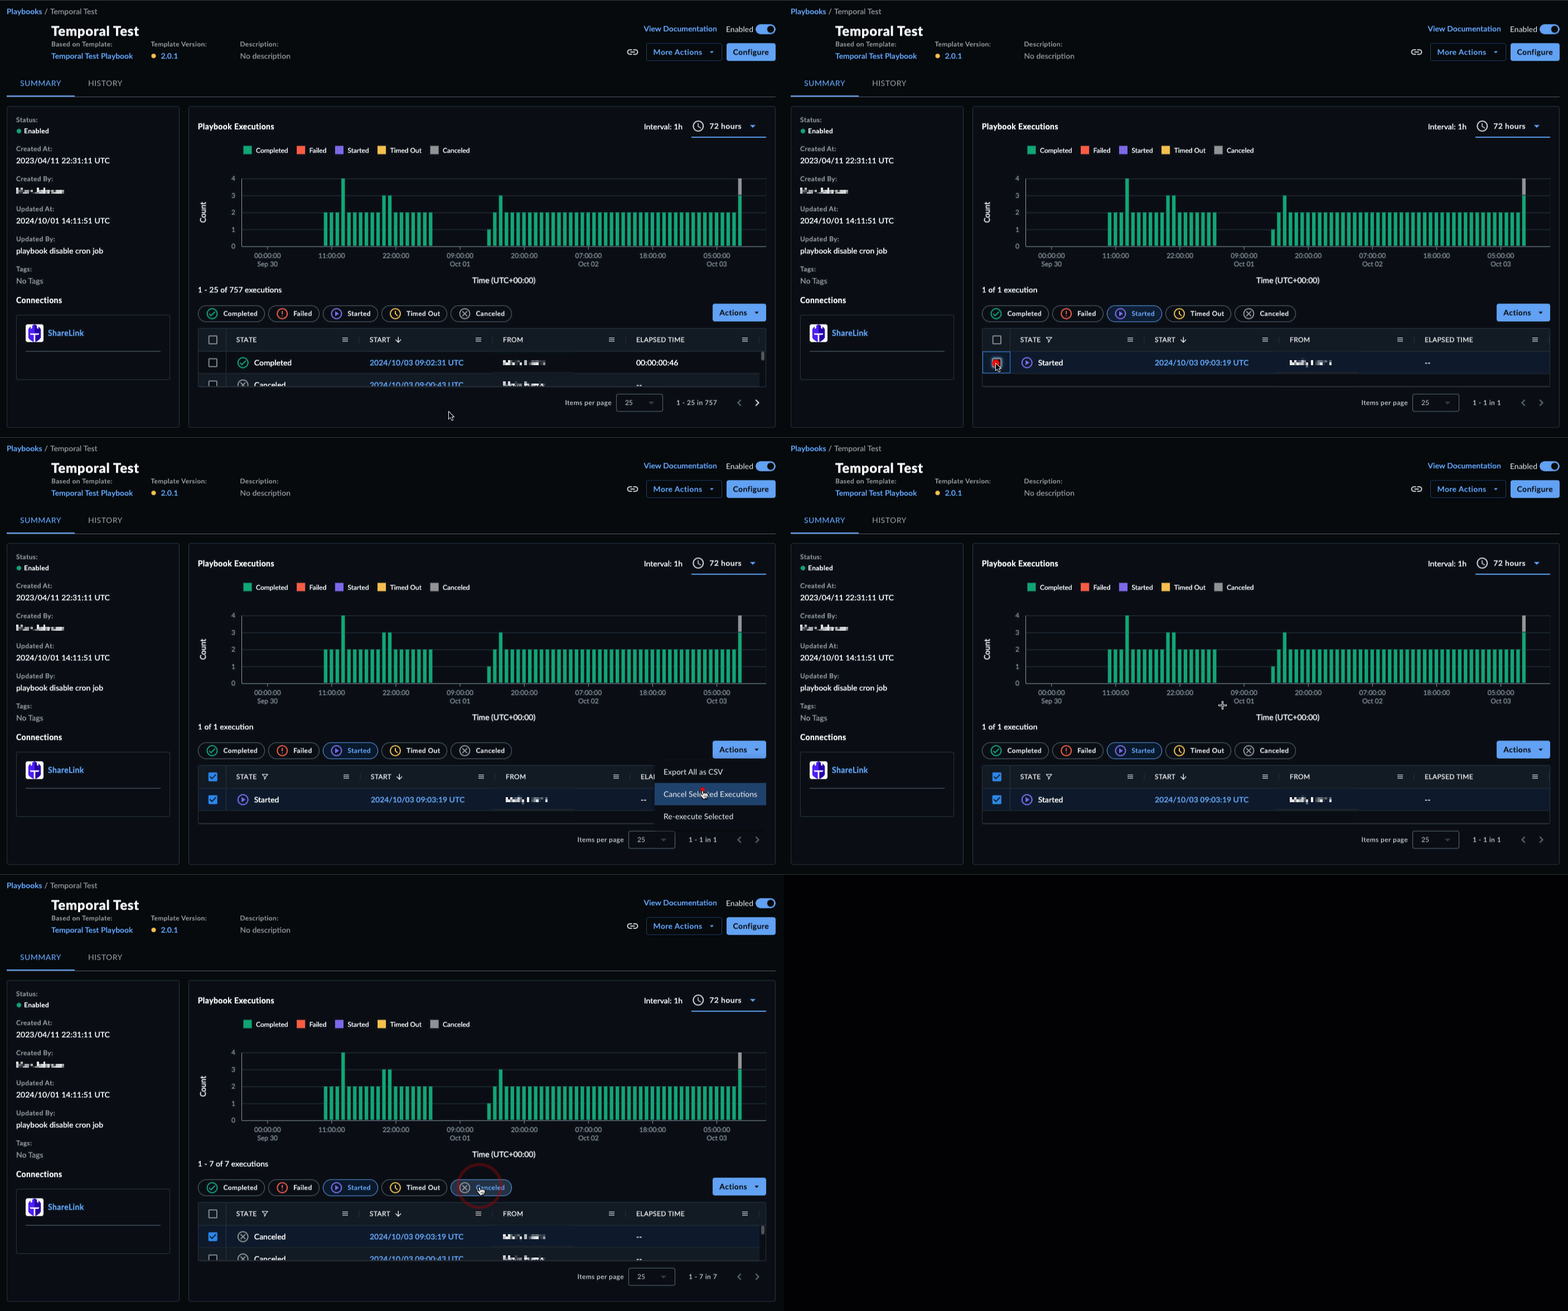
To cancel individual instances of a playbook’s execution, follow these steps.
- From the Playbooks Executions tab or a playbook’s Executions table, select the executions you would like to cancel using the checkboxes to the left.
- Select the Cancel Executions icon above the table.
- Select Proceed to confirm your action and cancel the executions.
Tip
To cancel ALL running executions for a single configured playbook, see Cancel Executions of a Playbook.
Re-Execute a Playbook Execution🔗
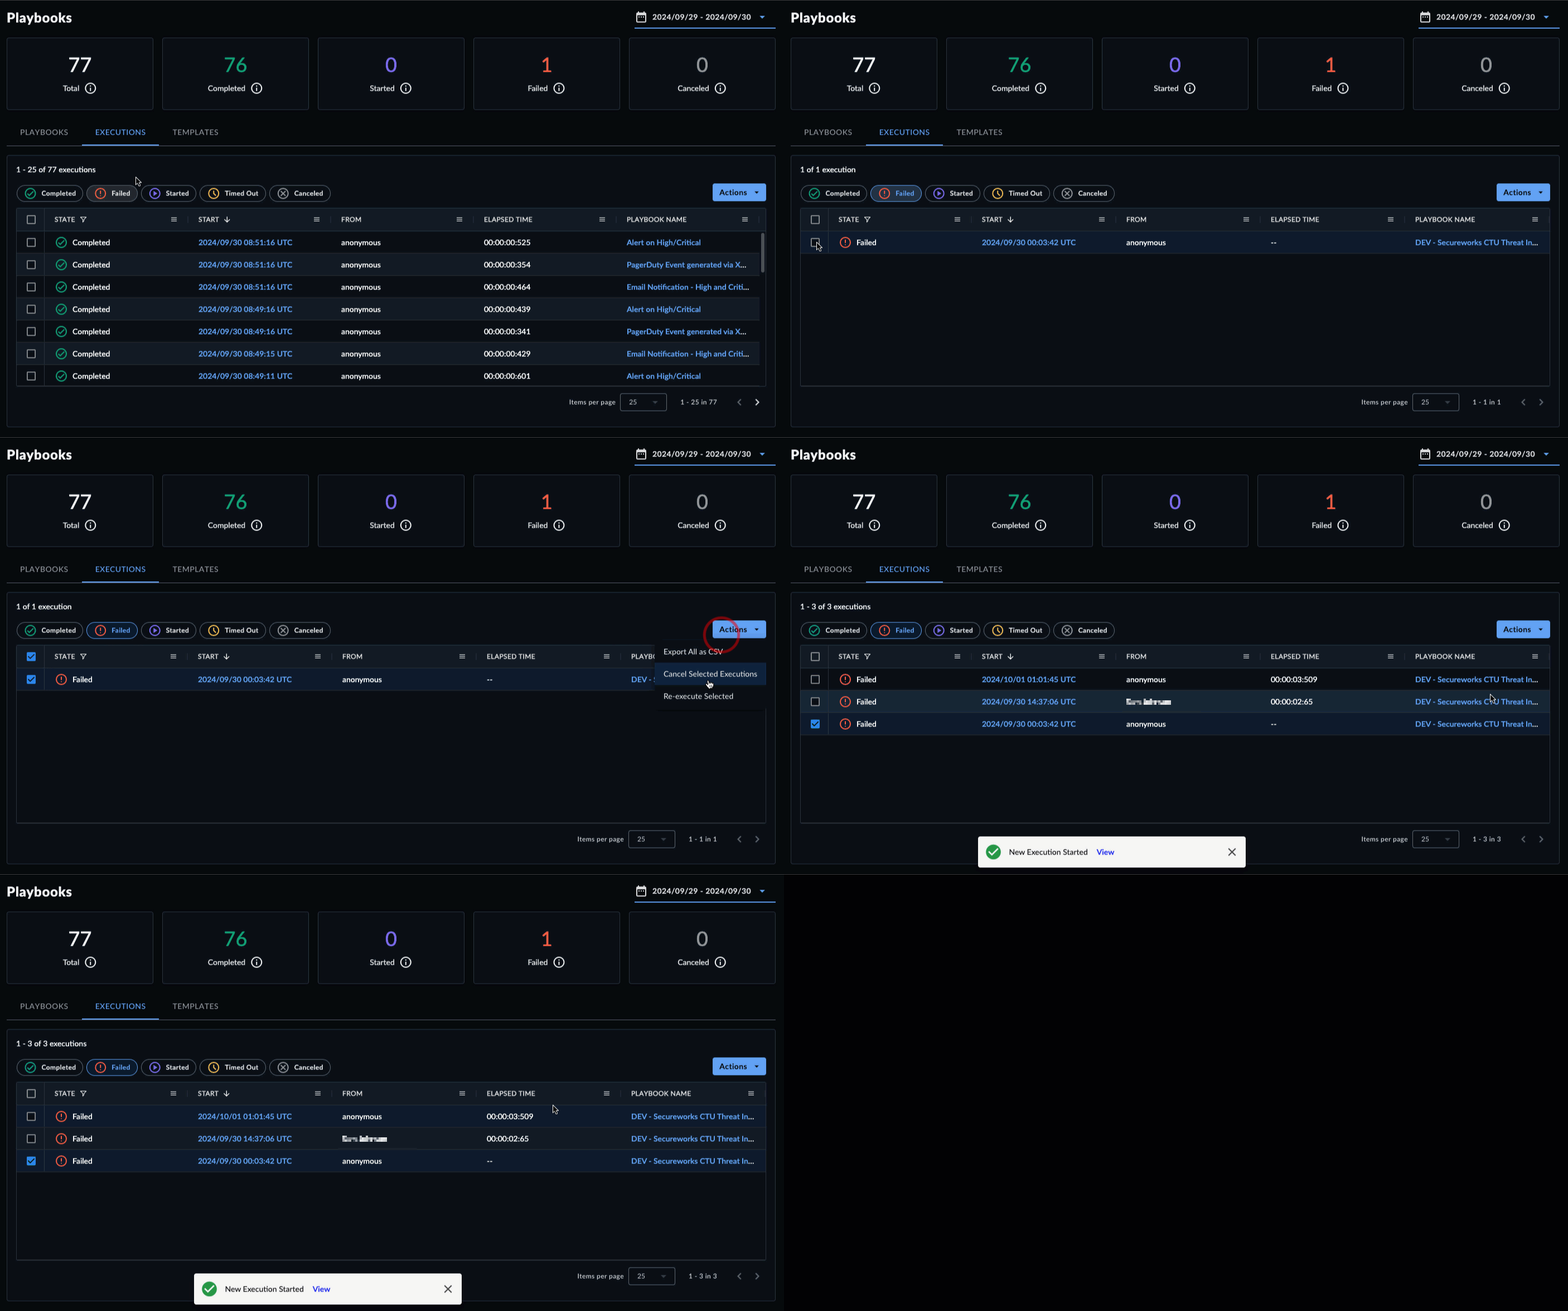
If you wish to re-run an execution (for example, because it failed), follow these steps:
- From the Playbooks Executions tab or a playbook's Executions table, select the execution(s) you would like to re-run using the checkboxes to the left.
- Select the Re-execute Playbooks icon above the table.
Export Playbook Execution History🔗
There are three ways to export a playbook's execution history:
-
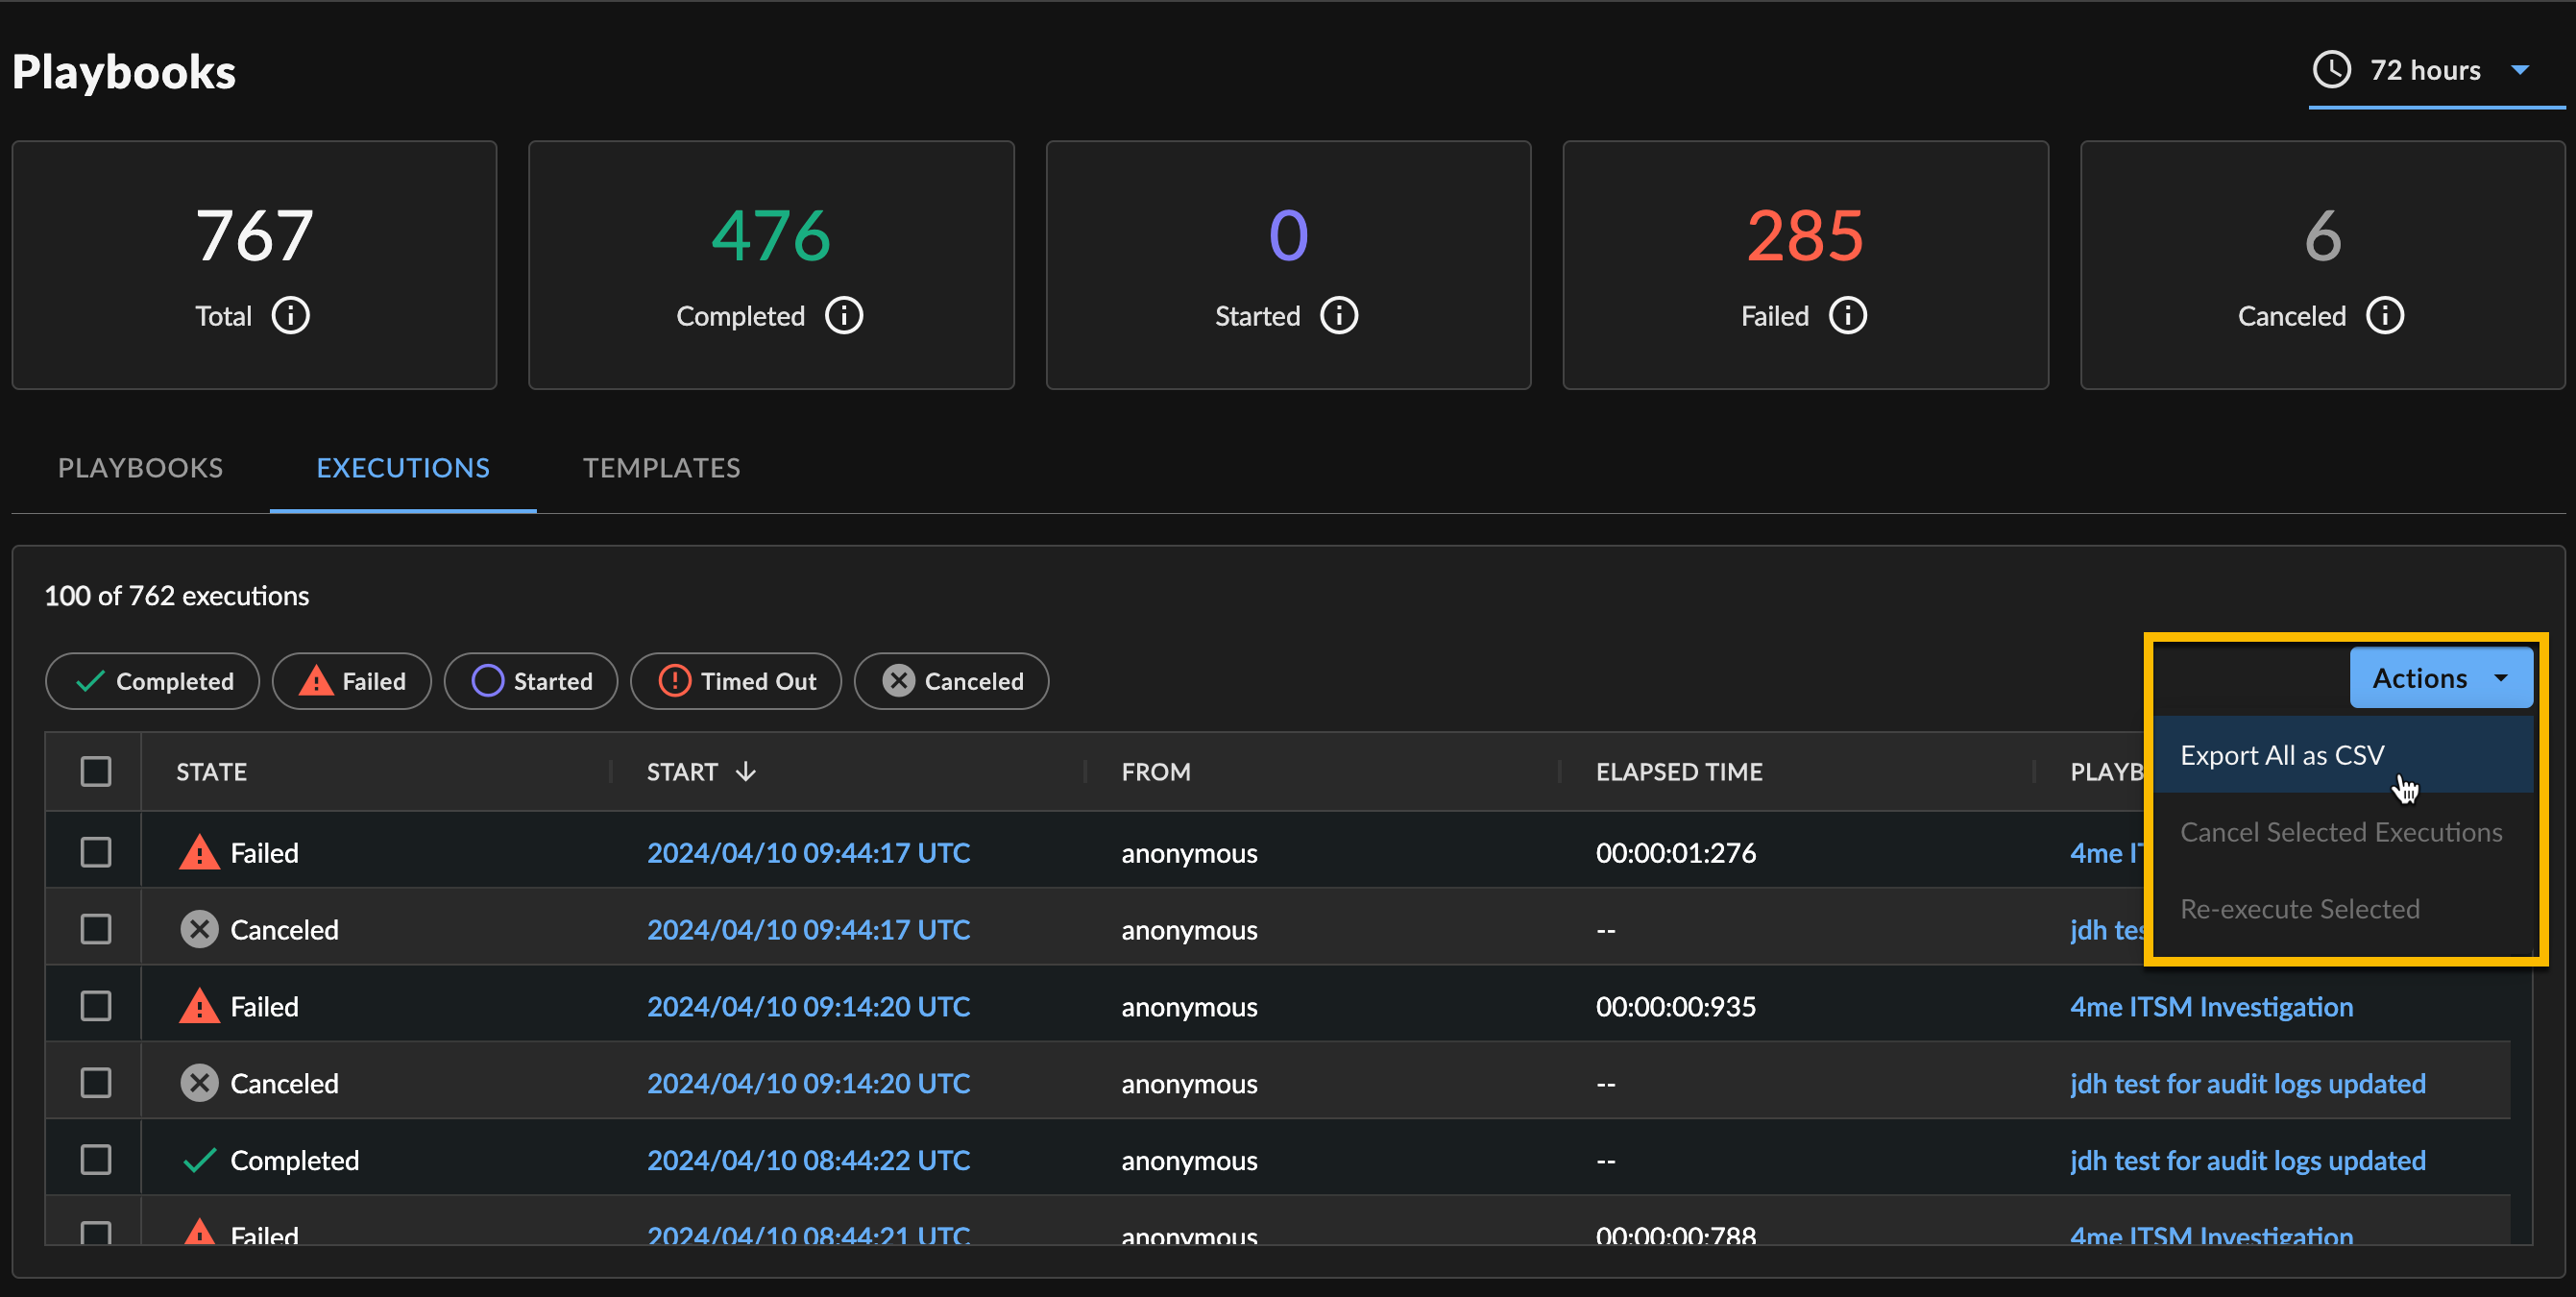
Click the Download icon above the table on the Playbooks Executions tab or a configured playbook details page for a CSV of the entire playbook execution history.
Export the Entire Playbook History -
Select Actions > Export as JSON on an execution details page for a JSON of the entire playbook that ran.
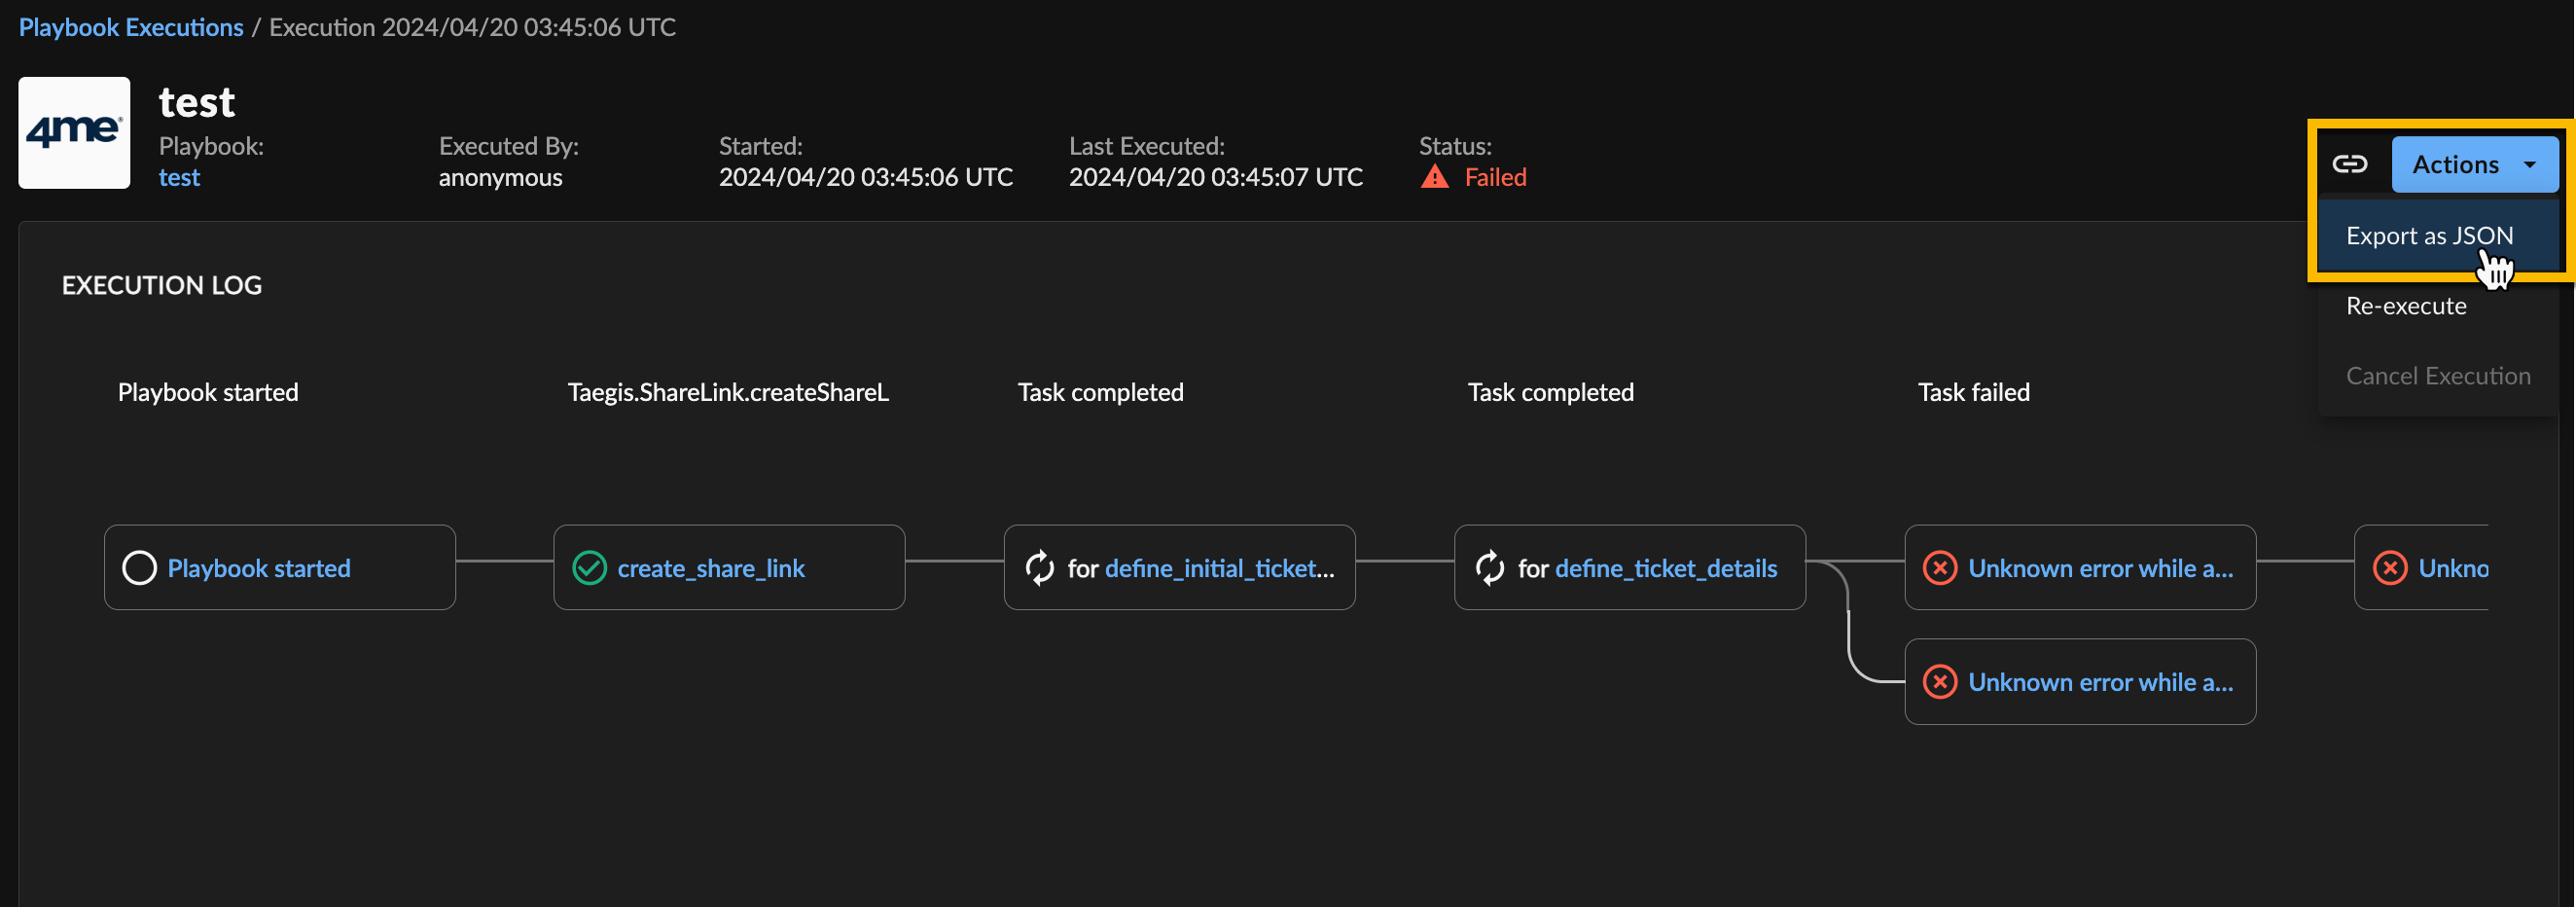
Export the Playbook -
Click the Download icon for a JSON of an individual playbook execution step.
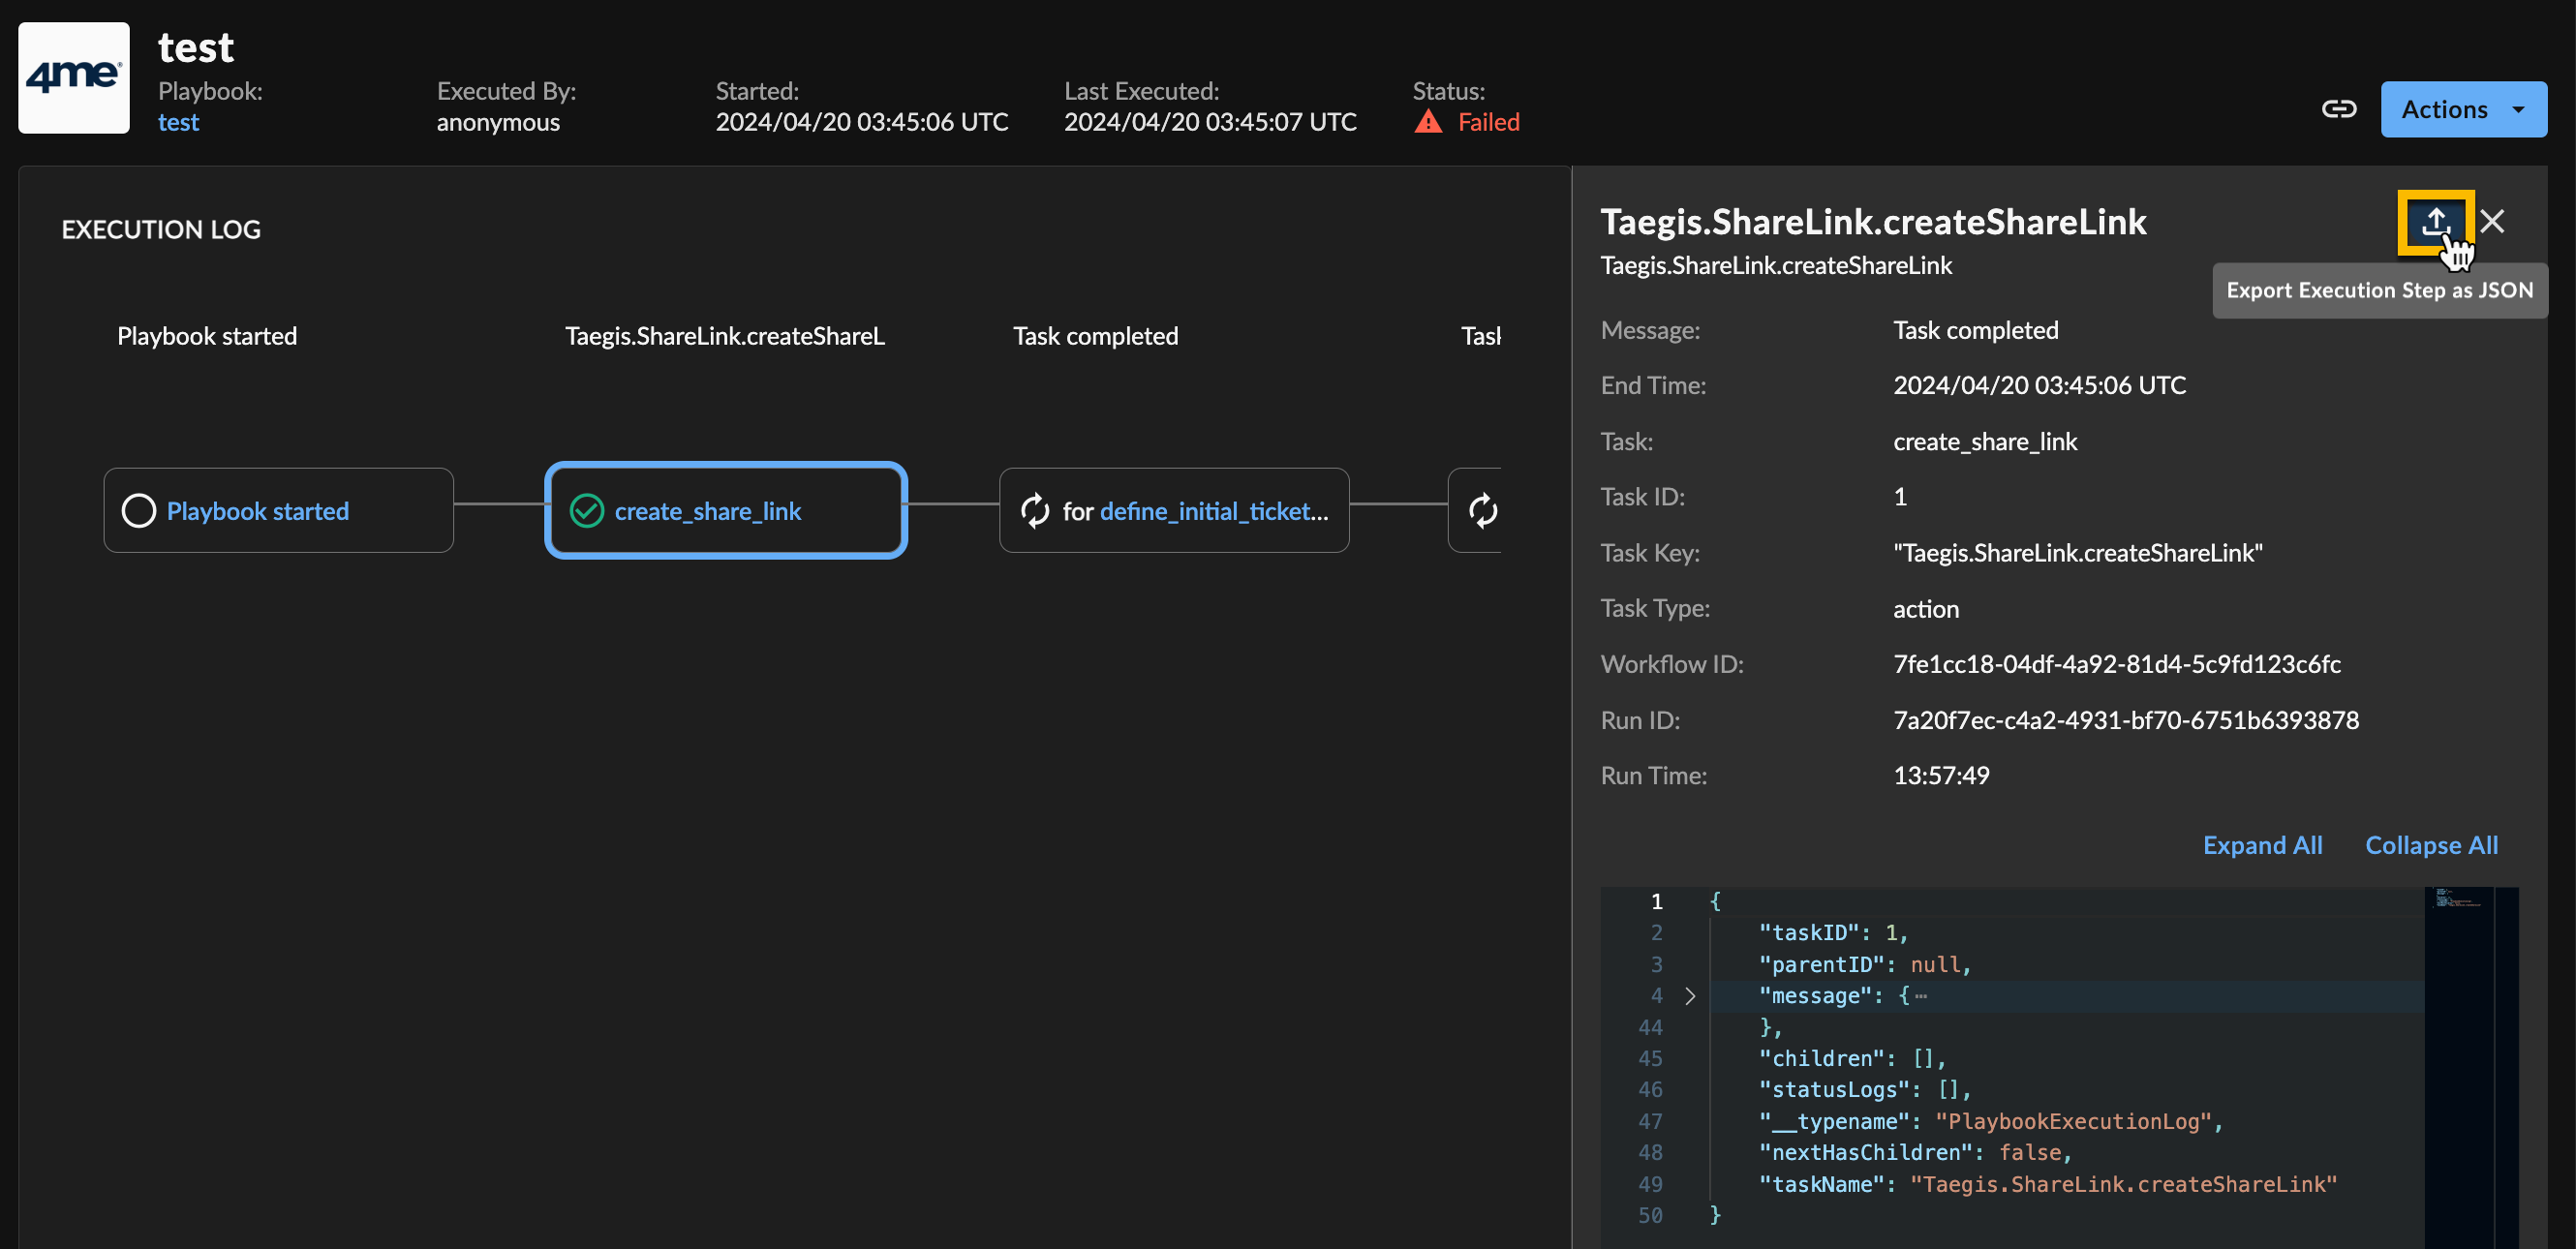
Export a Playbook Step
Share Playbook Execution🔗
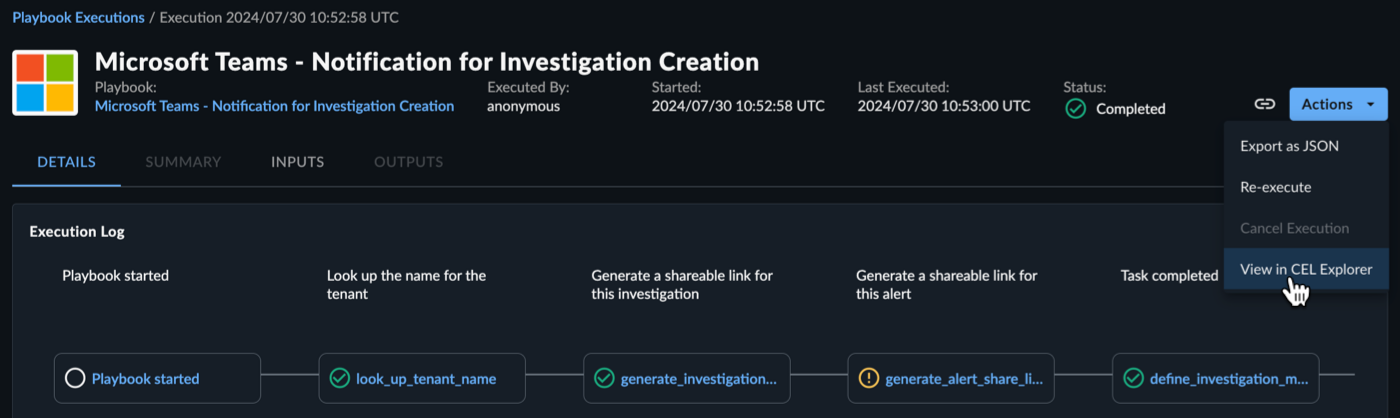
To share a specific playbook execution, select the copy share link icon from playbook execution details:
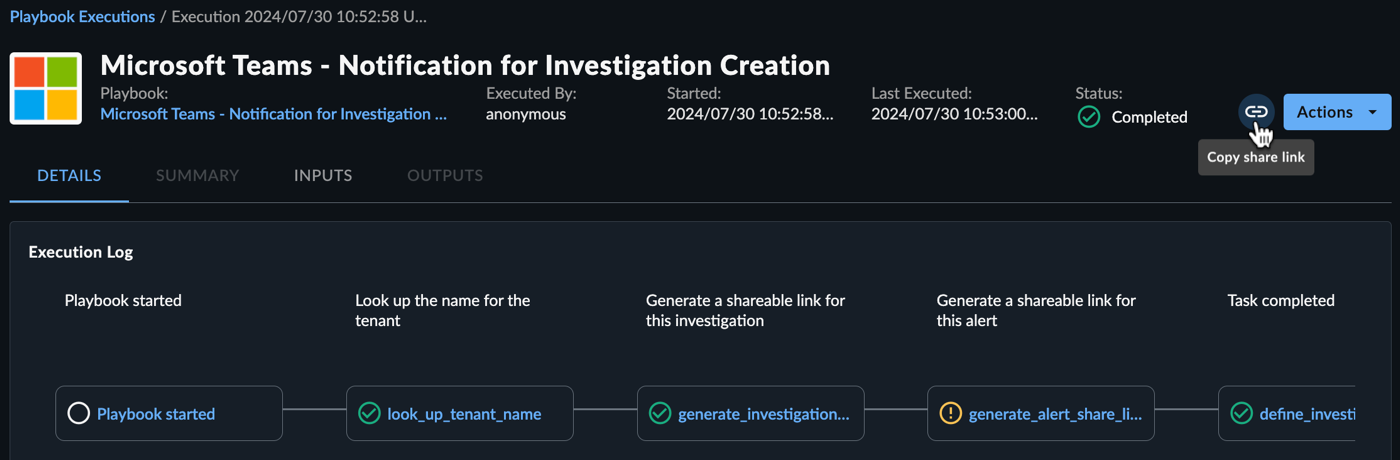
View Playbook Execution in CEL Explorer🔗
From the Actions menu, select View in CEL Explorer to test the outcome of CEL expressions against the data being viewed for use in Automations configurations. For more information, see CEL Explorer.