Manage NDR Devices🔗
Note
Taegis NDR is an evolution of iSensor, but with a new name and soon with expanded capabilities. You may see some references to the iSensor branding as we complete this transition.
For more information on Taegis™ NDR, see Taegis™ NDR Overview.
To view your organization’s current integrated Taegis™ NDR Devices, monitor their health, and manage their rules and registration, select Network from the Taegis Menu.
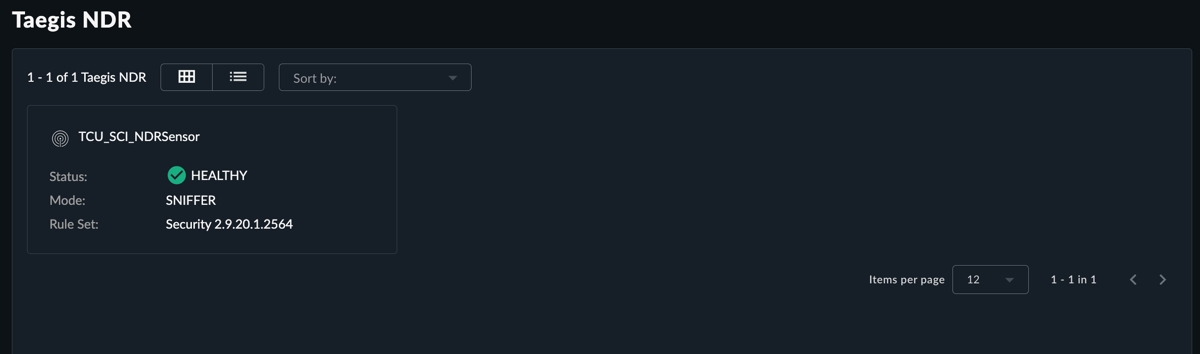
This page displays the NDR Devices that your organization has configured in a summary card or table view.
Adjust the Page View🔗
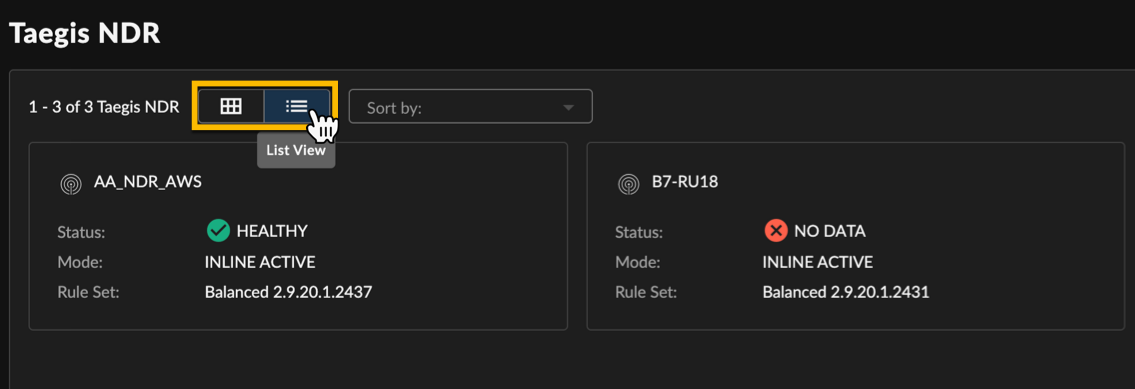
Switch between the summary card view and the list view of NDR using the buttons at the top of the page.
View NDR Device Status and Health🔗
The NDR page displays quick-view information about each NDR Device’s current status and recent activity:
- Health Status — The current health status of the NDR Device:
| Health Status | Description |
|---|---|
| HEALTHY | All NDR Device health metrics are reporting in as healthy. |
| WARNING | All NDR Device health metrics are reporting in, but at least one is having a problem. |
| NO DATA | The NDR Device health metrics have stopped coming in. |
| NOT REGISTERED | The NDR Device has not yet been deployed. |
- Mode — The current NDR Device traffic processing mode. See Traffic Processing Mode for more information.
| Mode | Description |
|---|---|
| INLINE ACTIVE | The NDR Device passes traffic through and will block traffic when alerted to do so. |
| INLINE PASSIVE | The NDR Device passes traffic through and will not block traffic when alerted to do so. |
| SNIFFER | The NDR Device will inspect traffic but the traffic will not pass through the NDR Device. |
- Rule Set — The current set of rules configured on the NDR Device with version. See Signature Sets for more information.
| Rule Set | Description |
|---|---|
| Connectivity | This rule set is designed to favor device performance over the security controls. |
| Security | This rule set is designed to favor security controls over device performance. |
| Balanced | This rules set is designed to balance the security needs and performance characteristics. |
Tip
Run the NDR Change Management Report for detailed information about signature and rule set updates made for each NDR Device in your tenant. For more information, see Taegis™ NDR Change Management Report.
View Detailed NDR Device Information🔗
Select a card from the summary card view or the NDR Device name from the list view to open additional details about the NDR Device.
Note
You must be a Tenant Administrator to make changes to an NDR Device.
Important
Making changes to the NDR Device configuration of a live NDR Device carries the risk of rendering the NDR Device inoperable and/or allowing or blocking certain traffic on your network. The NDR Device will make every attempt possible to rollback to the previous configuration when a configuration change is unsuccessful. NDR Device configuration changes should be treated with the same level of caution used for any other kind of change in your environment according to your risk and change management guidelines. You should always be prepared to redeploy to the device.
Details🔗
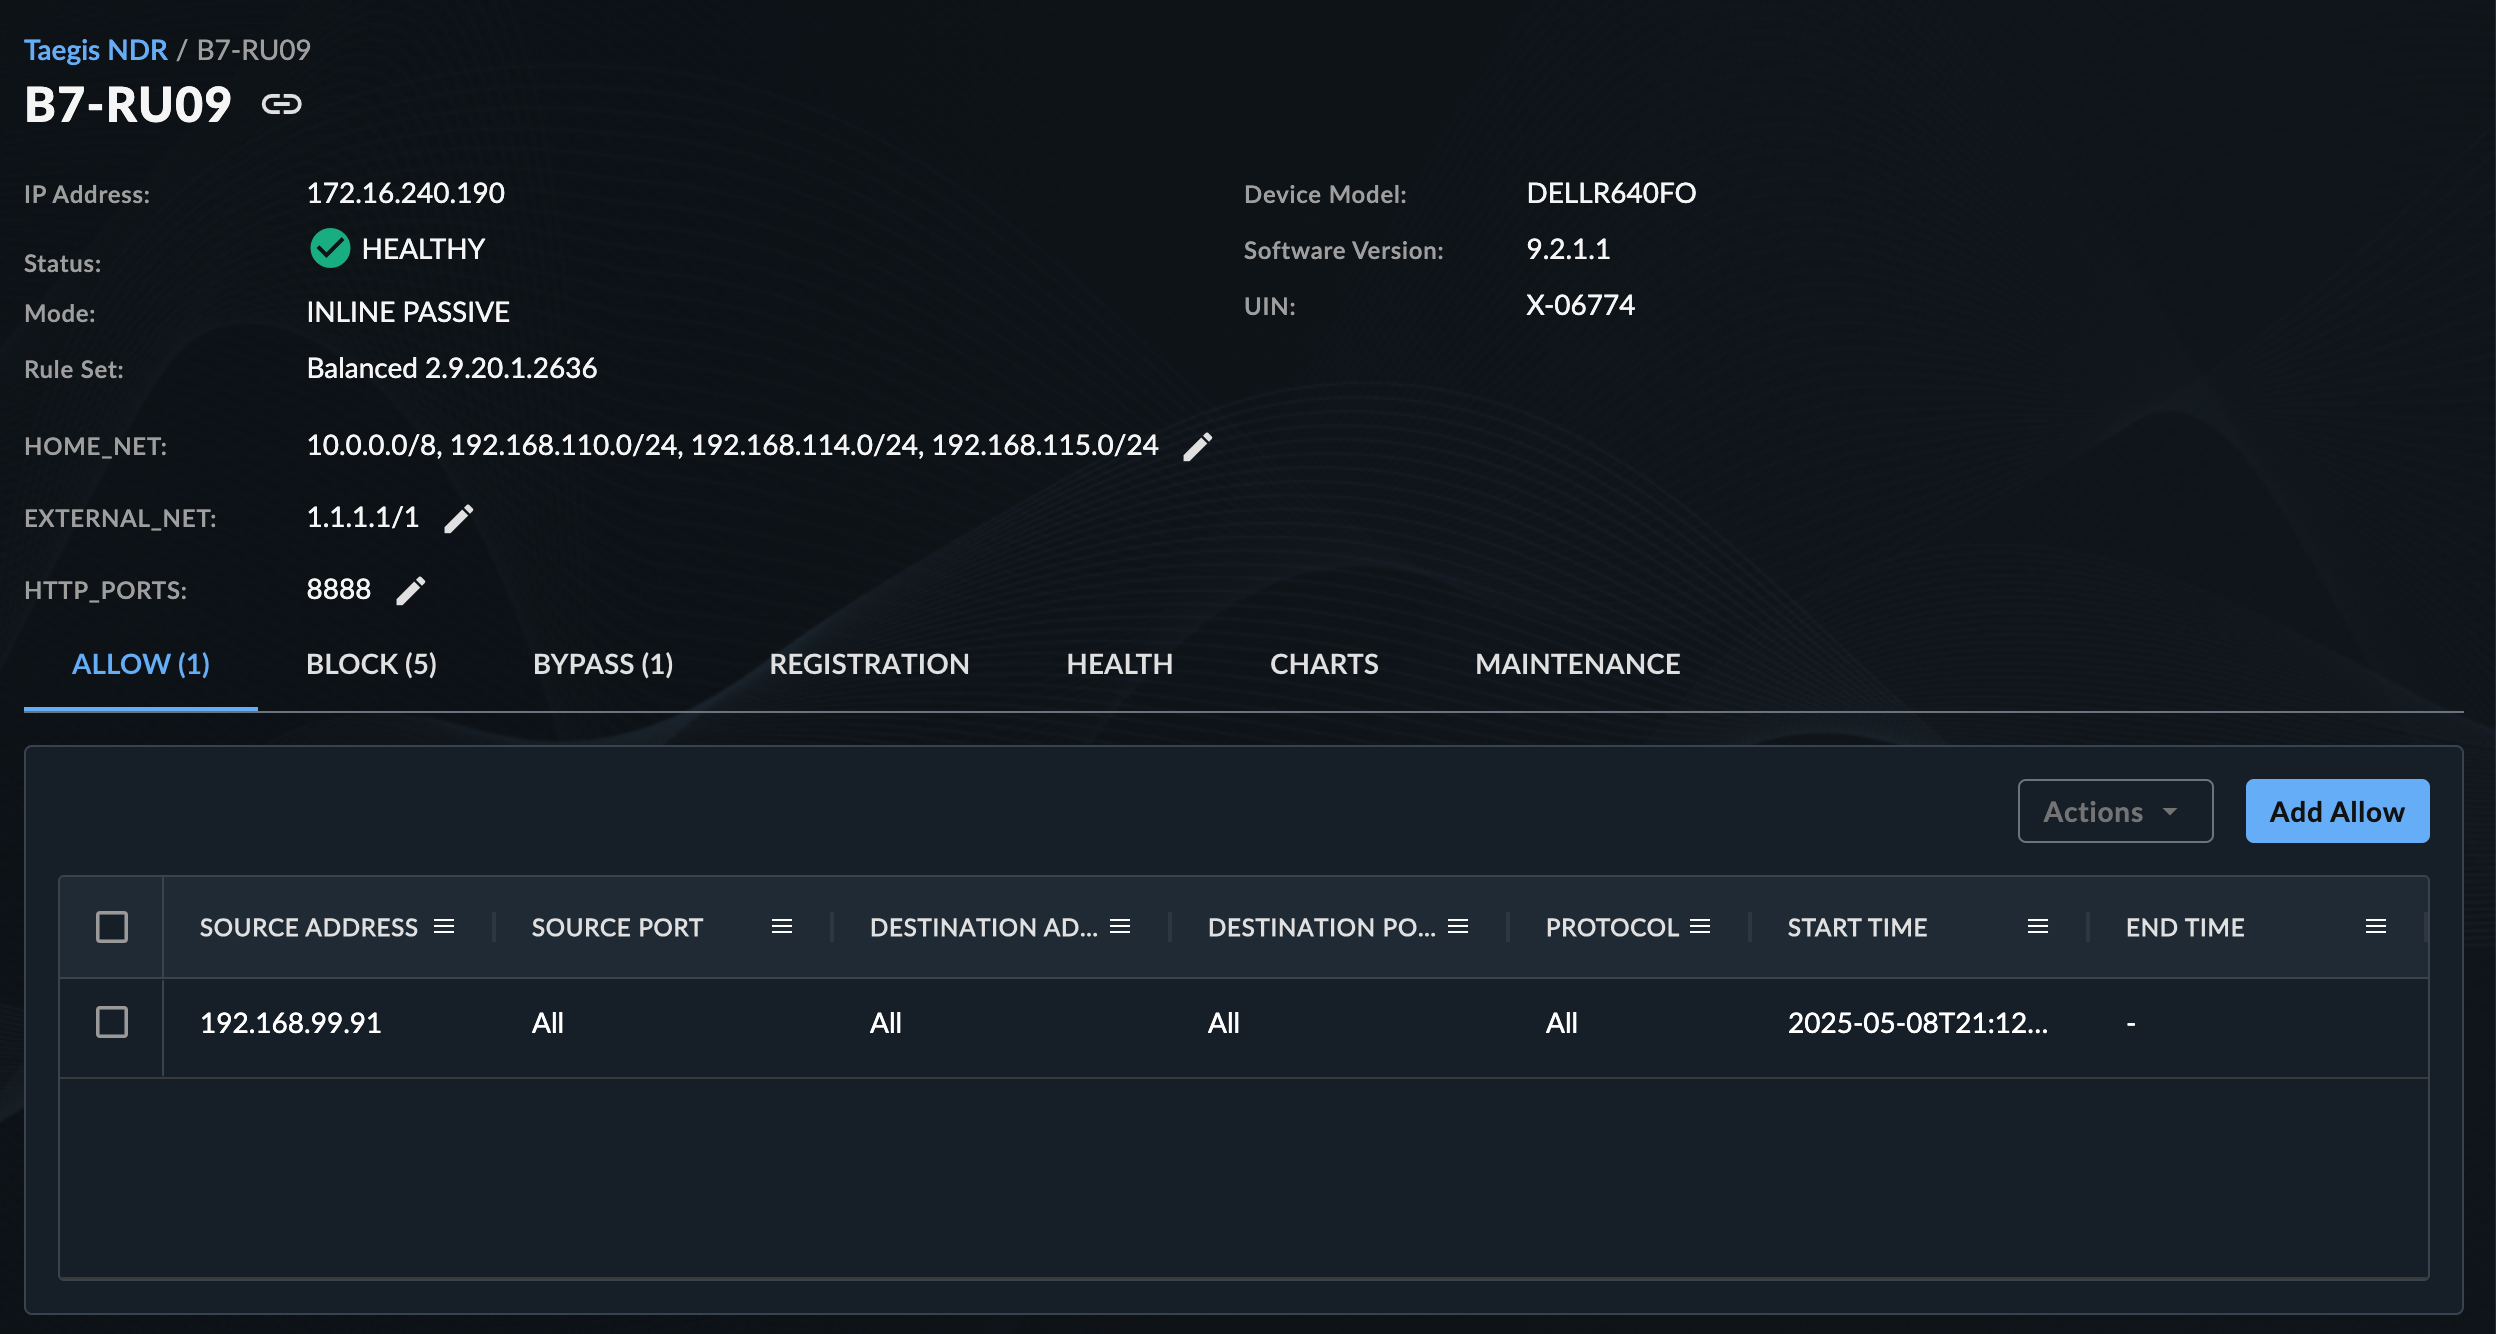
The top section displays the following details about the NDR Device. Select the link to view more information about each item.
- Name
- IP address
- Health Status
- Mode
- Rule Set
- HOME_NET defined on the device; see Edit HOME_NET for details on editing
- EXTERNAL_NET defined on the device; see Edit EXTERNAL_NET for details on editing
- HTTP_PORTS defined on the device; see Edit HTTP_PORTS for details on editing
Note
See the following sections to update the values of HOME_NET, EXTERNAL_NET, and HTTP_PORTS. For changing any other NDR Device settings, like the name and IP address, please contact support.
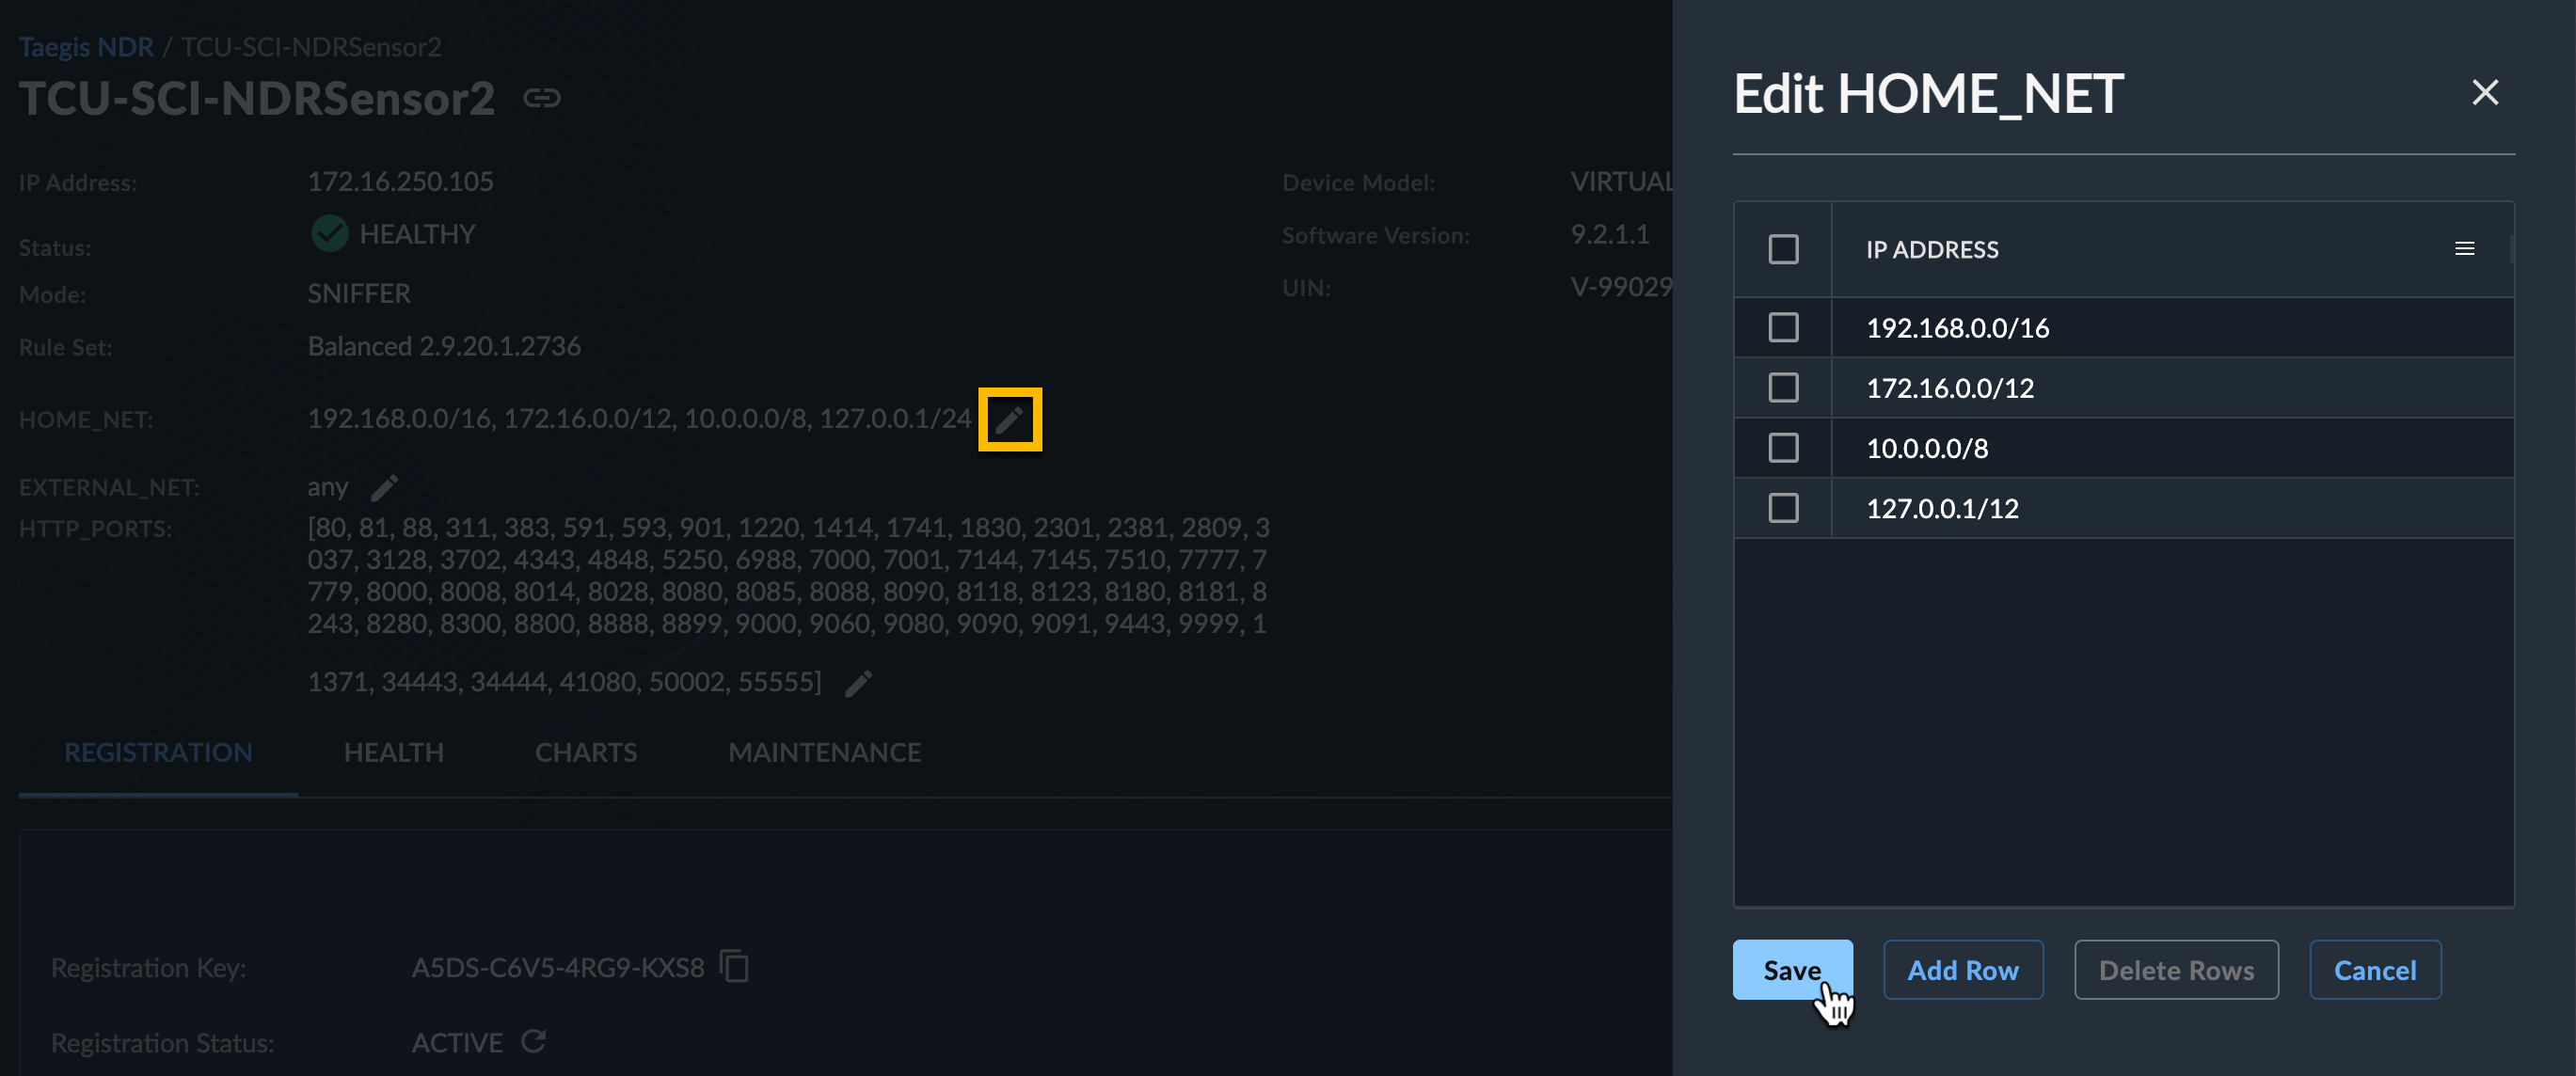
Edit HOME_NET🔗
To edit the HOME_NET defined on the NDR Device, follow these steps:
- Select the Edit HOME_NET pencil icon. The Edit HOME_NET side drawer displays.
- Choose Add Row and enter a new IP address or range. The entry displays red if improperly formatted.
- Select one or more rows with the checkboxes and choose Delete Rows to remove those entries.
- Once finished, select Save to return to the NDR Device details.
- Once the update is complete, a message displays the status of the rule deployment. Select More Information to view the complete results.
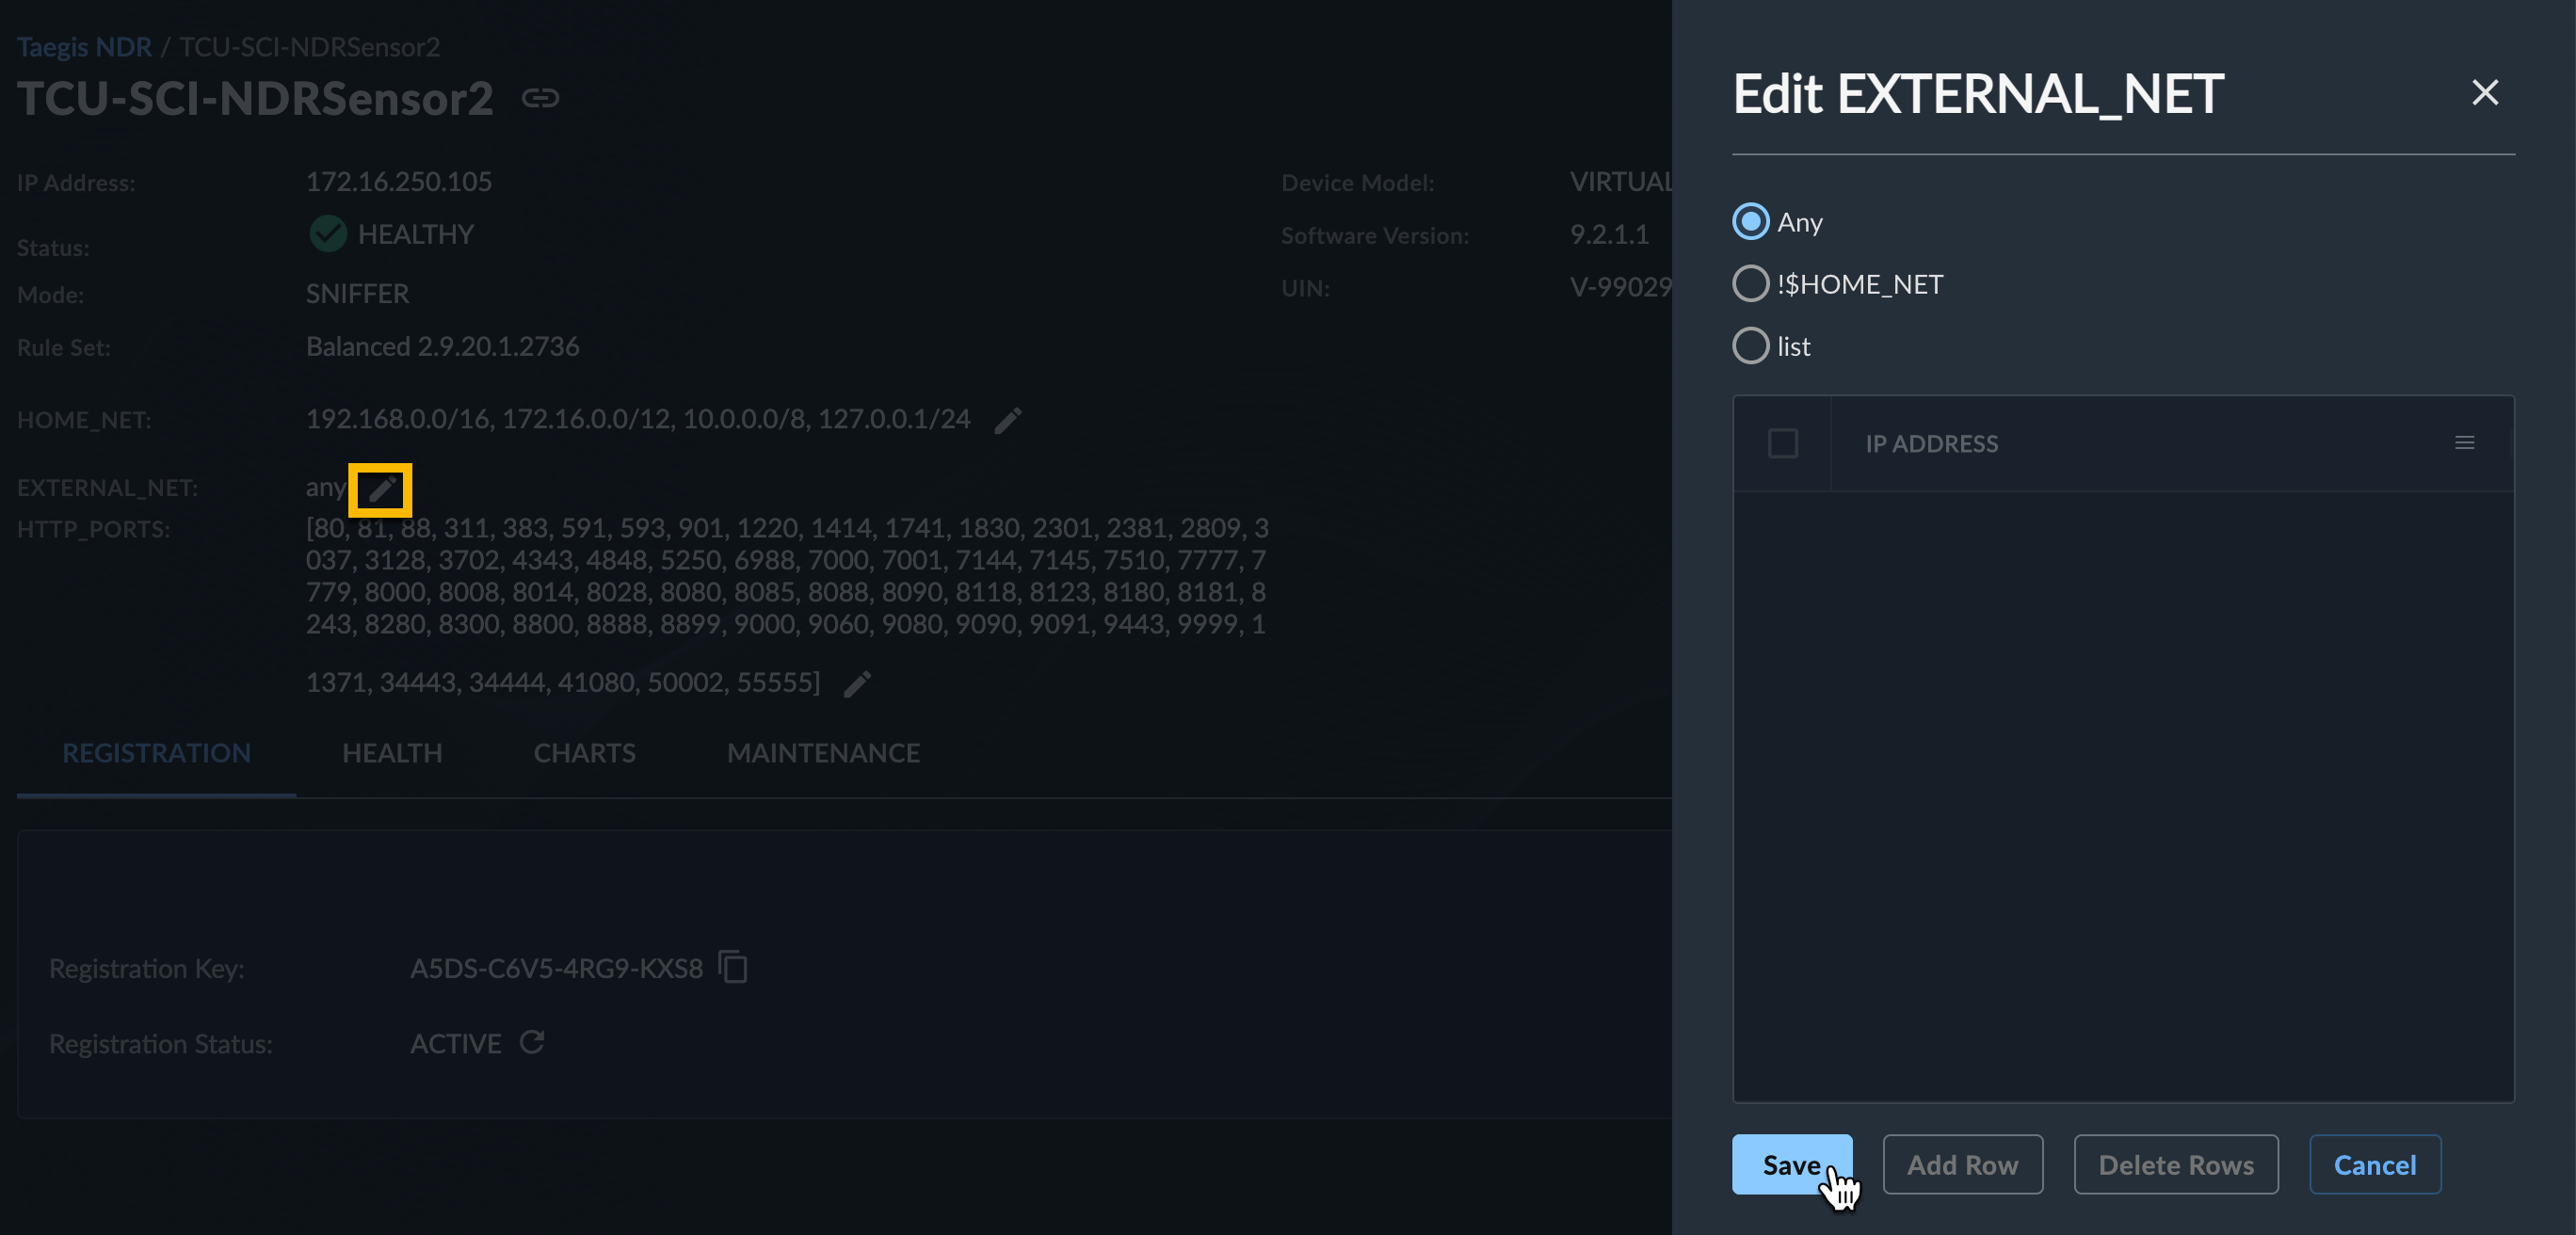
Edit EXTERNAL_NET🔗
To edit the EXTERNAL_NET defined on the NDR Device, follow these steps:
- Select the Edit EXTERNAL_NET pencil icon. The Edit EXTERNAL_NET side drawer displays.
-
Choose one of the following options:
- Any — Traffic from any source
- !$HOME_NET — Traffic from all sources not defined by HOME_NET, which is the traditional configuration
- List — Traffic from a customized list of sources
-
If choosing the List option:
- Select Add Row to enter a new IP address or range. The entry displays red if improperly formatted.
- Select one or more rows with the checkboxes and choose Delete Rows to remove those entries.
-
Once finished, select Save to return to the NDR Device details.
- Once the update is complete, a message displays the status of the rule deployment. Select More Information to view the complete results.
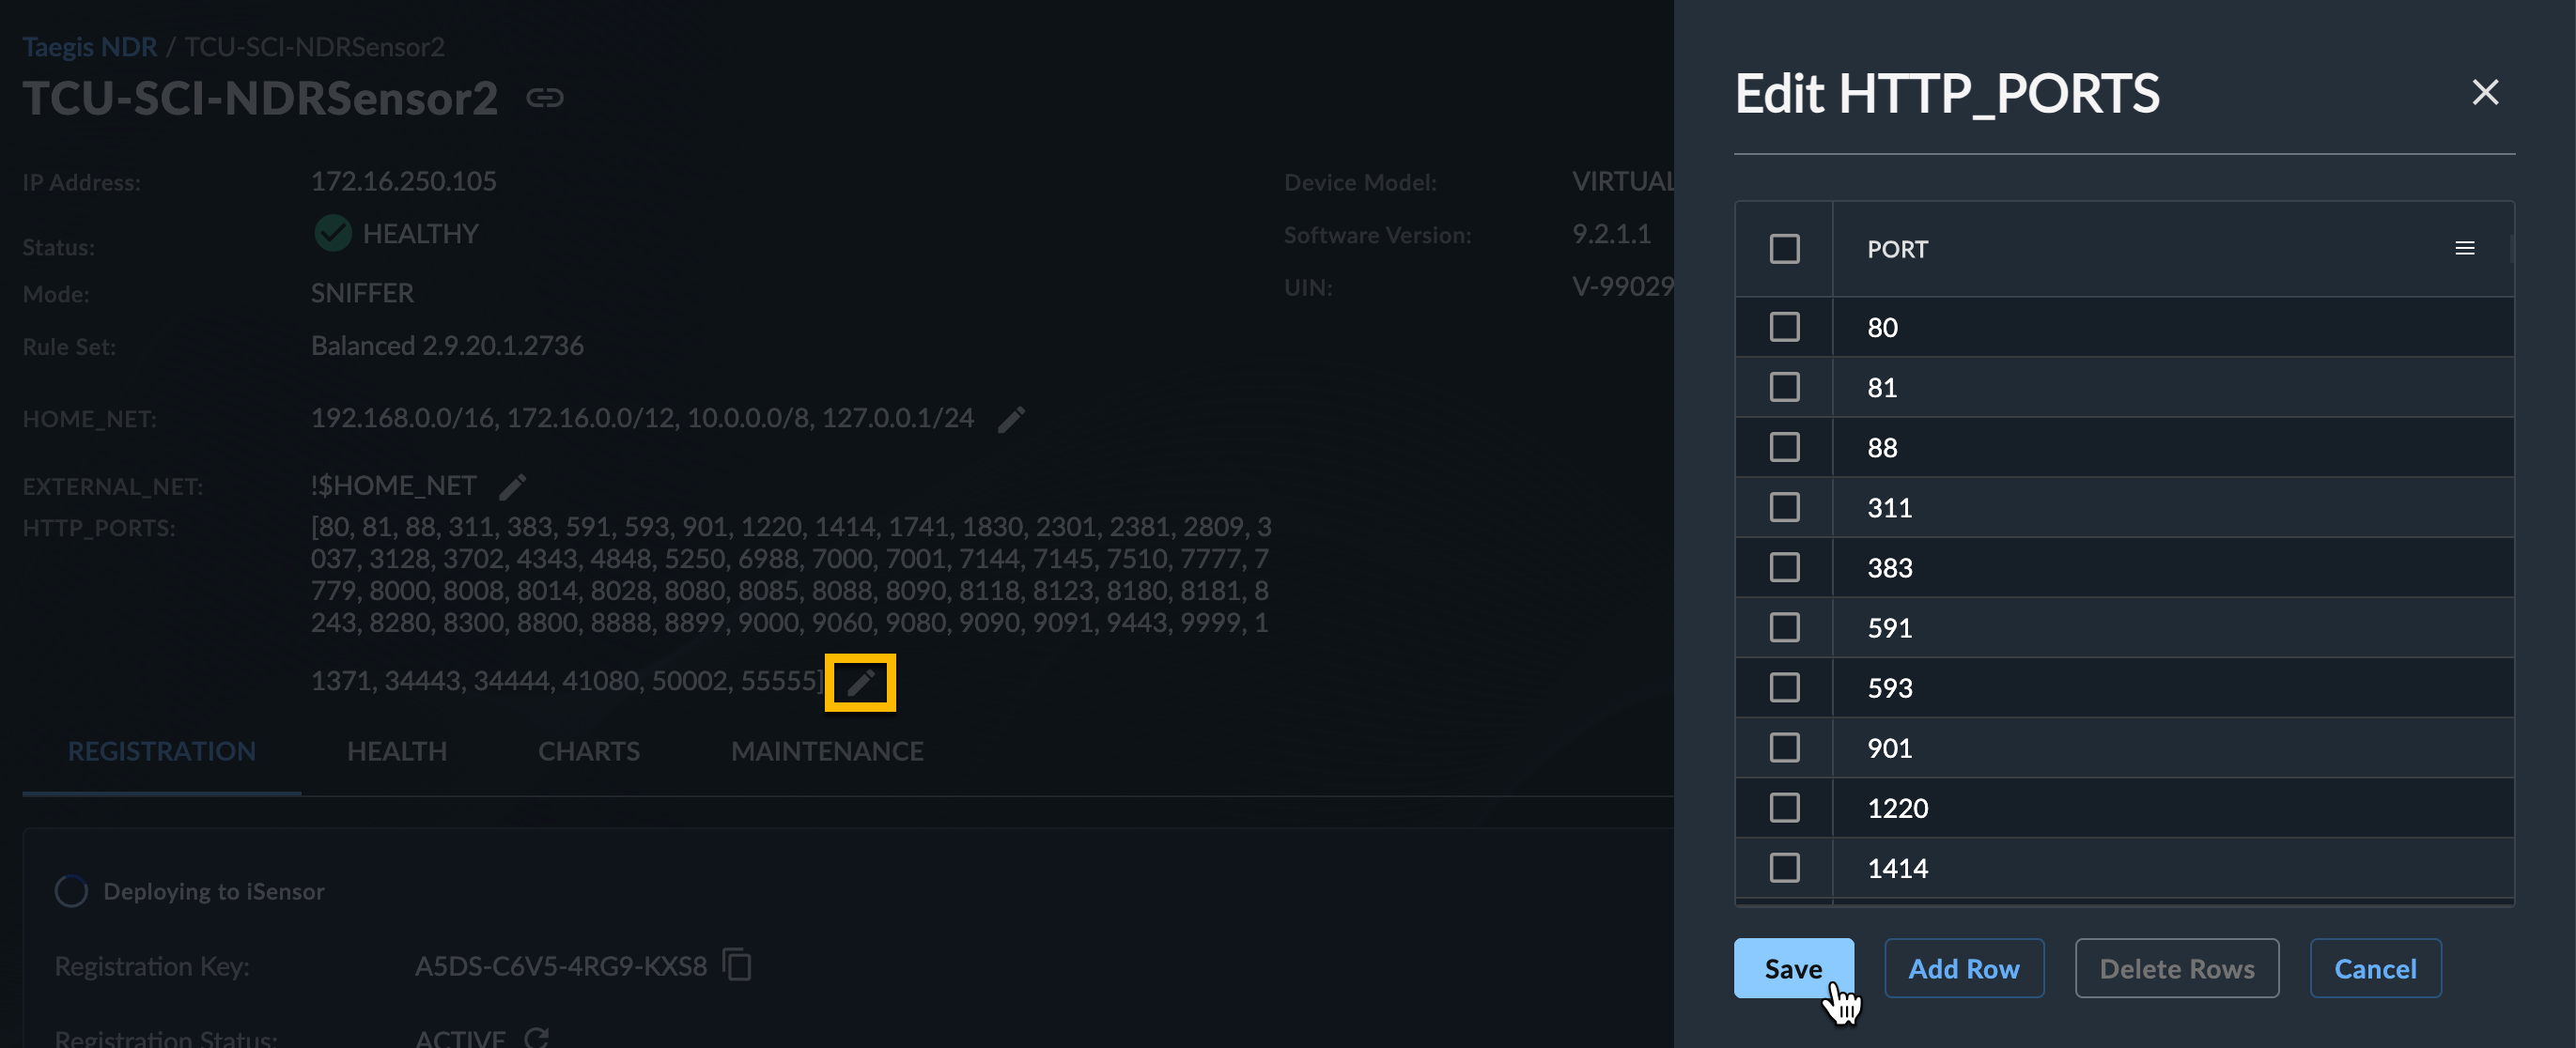
Edit HTTP_PORTS🔗
To edit the HTTP_PORTS defined on the NDR Device, follow these steps:
- Select the Edit HTTP_PORTS pencil icon. The Edit HTTP_PORTS side drawer displays.
- Choose Add Row and enter a new port number. The entry displays red if improperly formatted.
- Select one or more rows with the checkboxes and choose Delete Rows to remove those entries.
- Once finished, select Save to return to the NDR Device details.
- Once the update is complete, a message displays the status of the rule deployment. Select More Information to view the complete results.
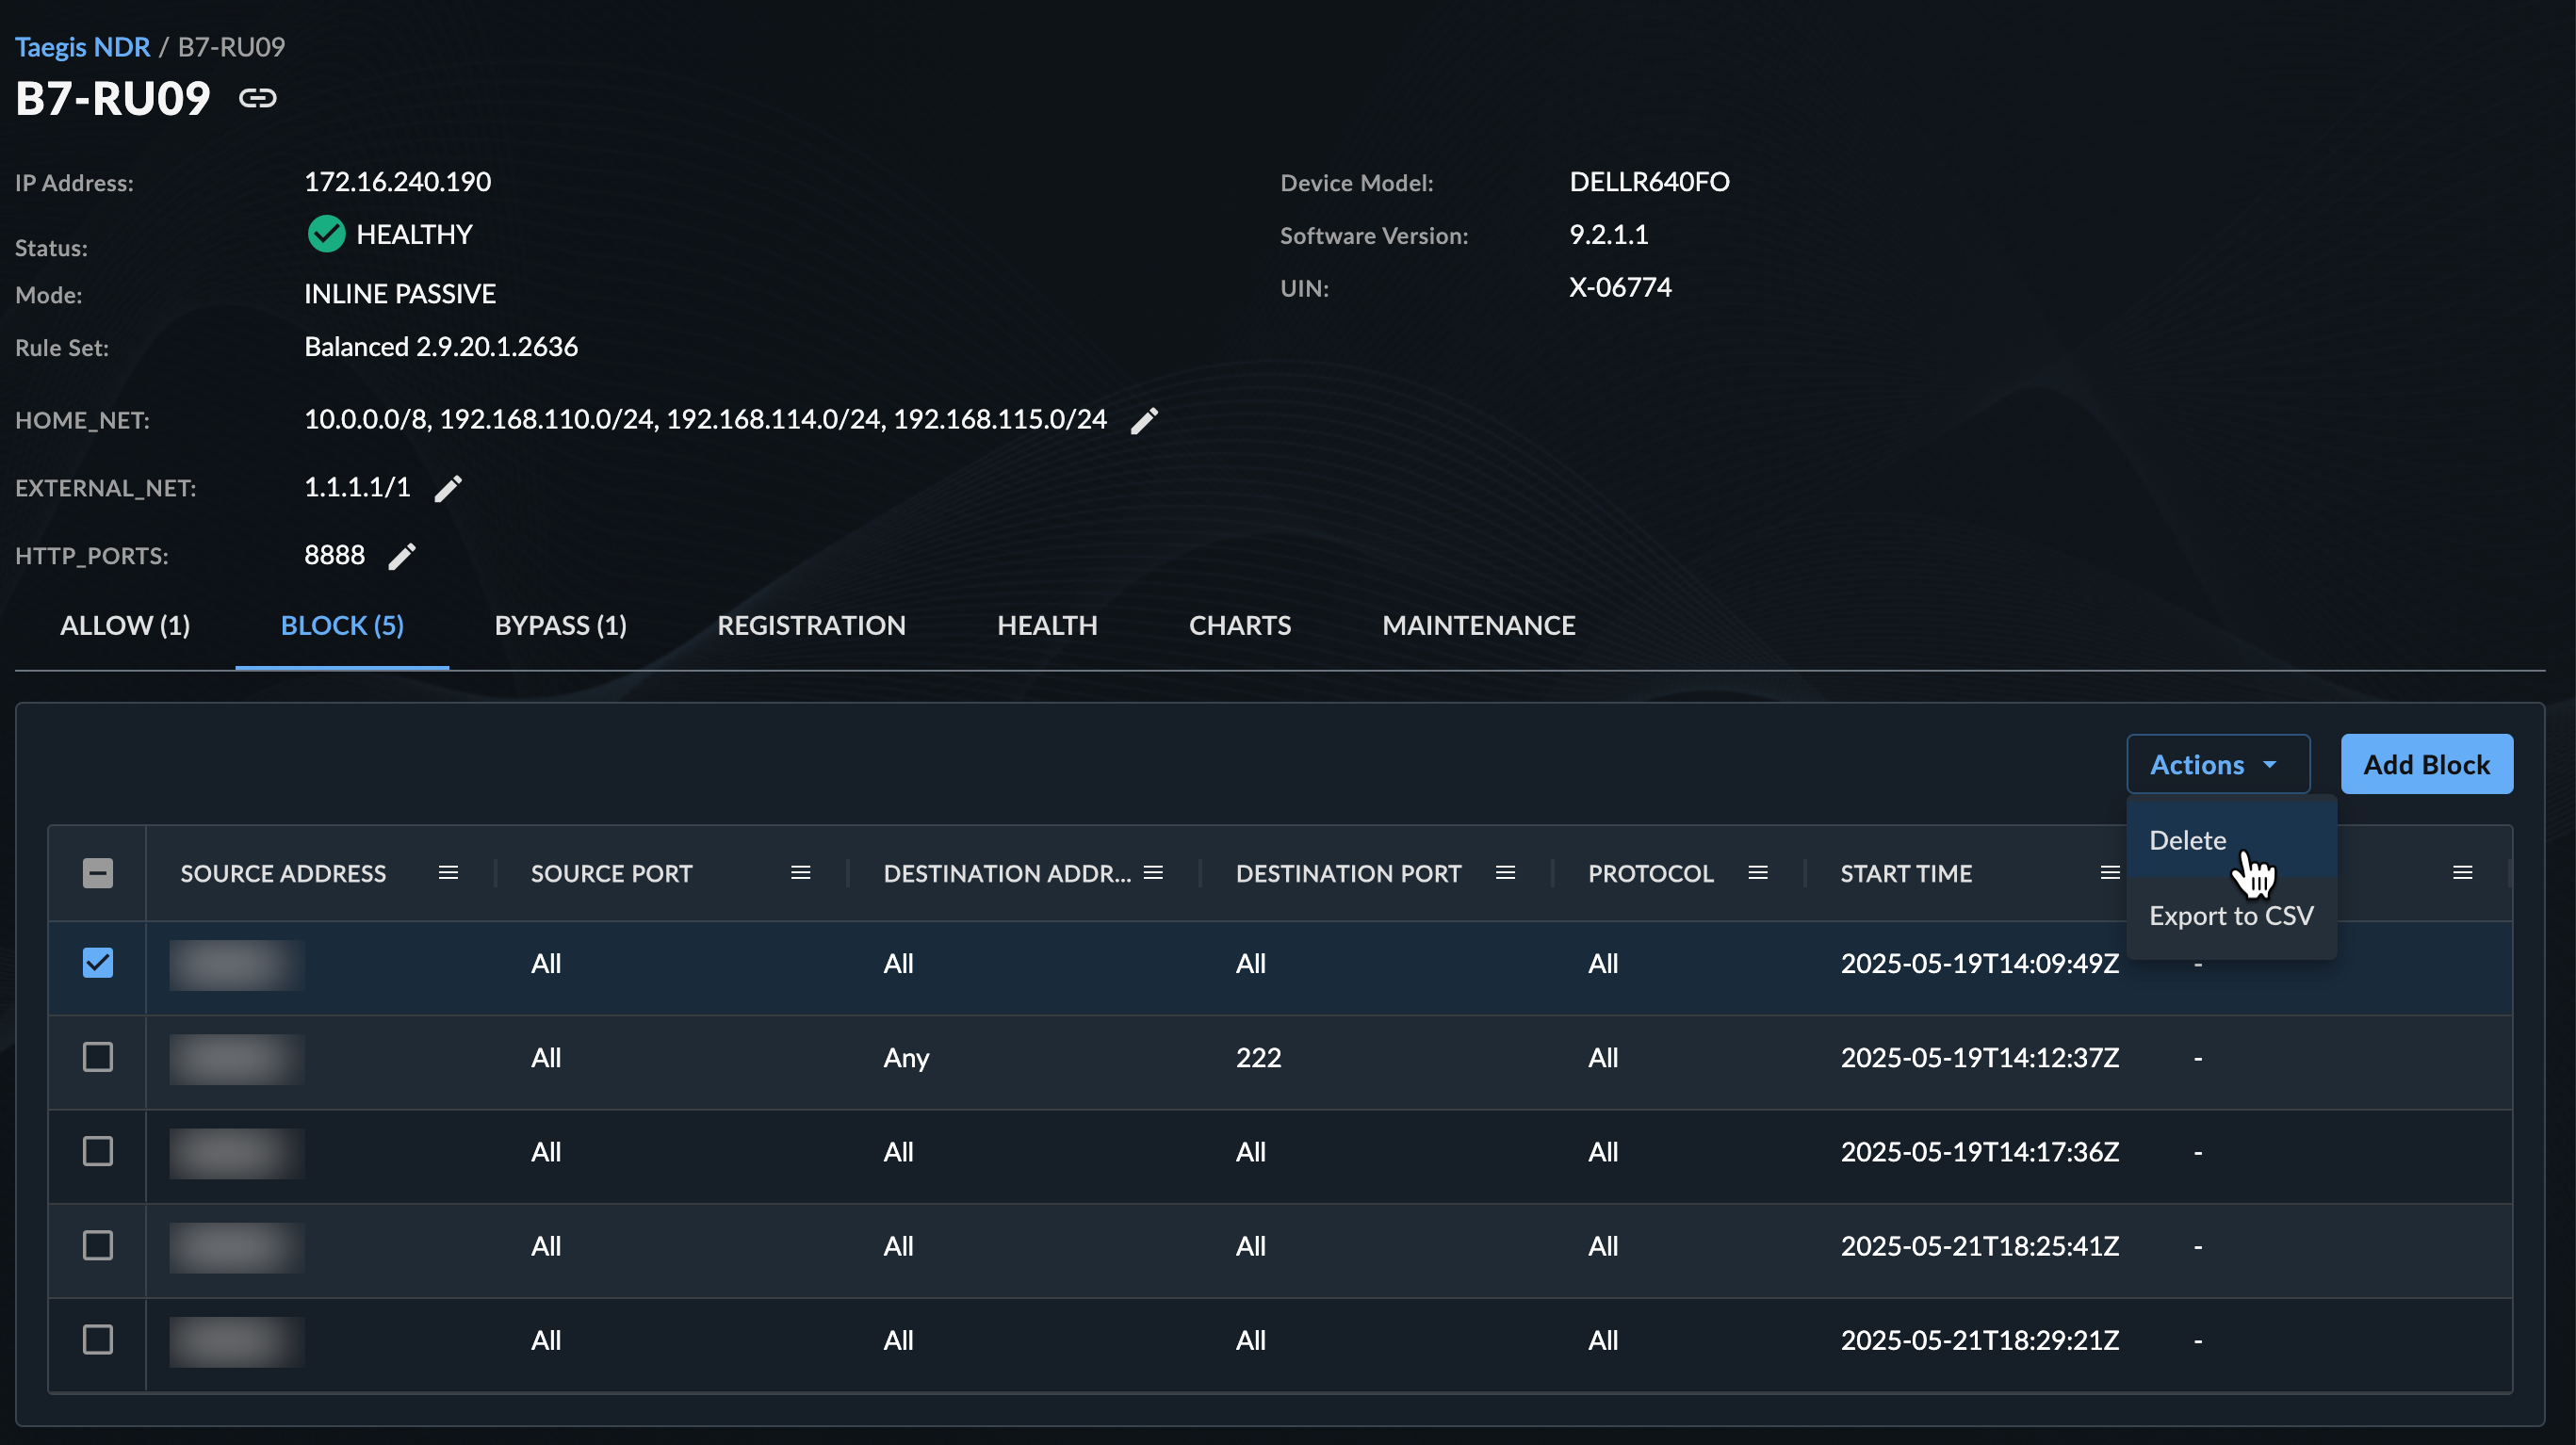
Allow and Block Tabs🔗
The Allow and Block tabs display a list of firewall rules configured on the NDR Device. Allow rules allow traffic to pass, while Block rules block traffic.
Actions🔗
Select one or more rules from the list and then choose the Actions menu to Delete or Export to CSV the selected rules.
Add Allow or Block🔗
To add a new Allow or Block rule to the NDR Device:
-
Select Add Allow or Add Block; the Add Allow/Block Rule form displays.
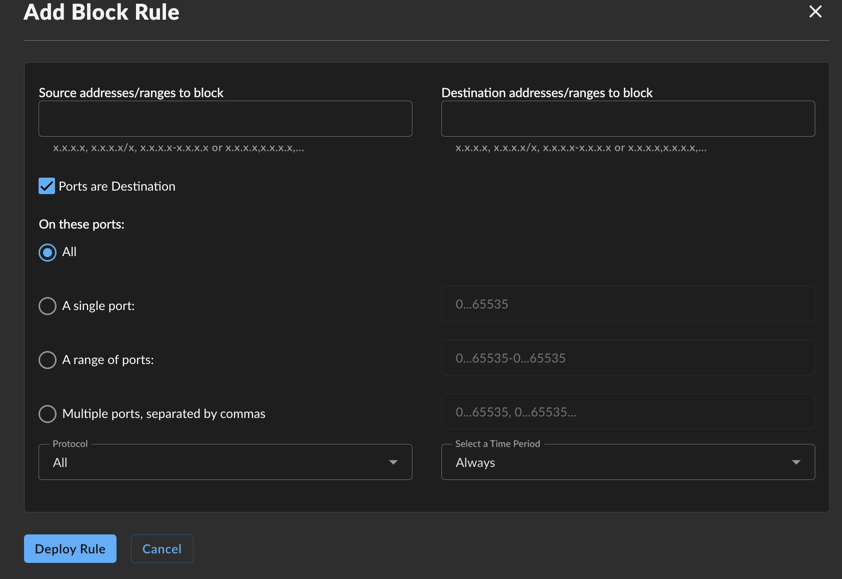
Add NDR Device Block Rule -
Enter at least one Source or Destination address or range.
- The Ports are Destination checkbox is checked by default; uncheck this option if the port definitions for the rule are source ports.
- Specify the ports for the rule: All (default), a single port, a range of ports, or multiple ports separated by commas.
- Select the desired protocol, or leave at the default of all protocols.
- Select the desired time frame the rule is to be in effect, or leave at the default of always in effect.
- Select Deploy Rule to save the rule and attempt to deploy the rule to the NDR Device.
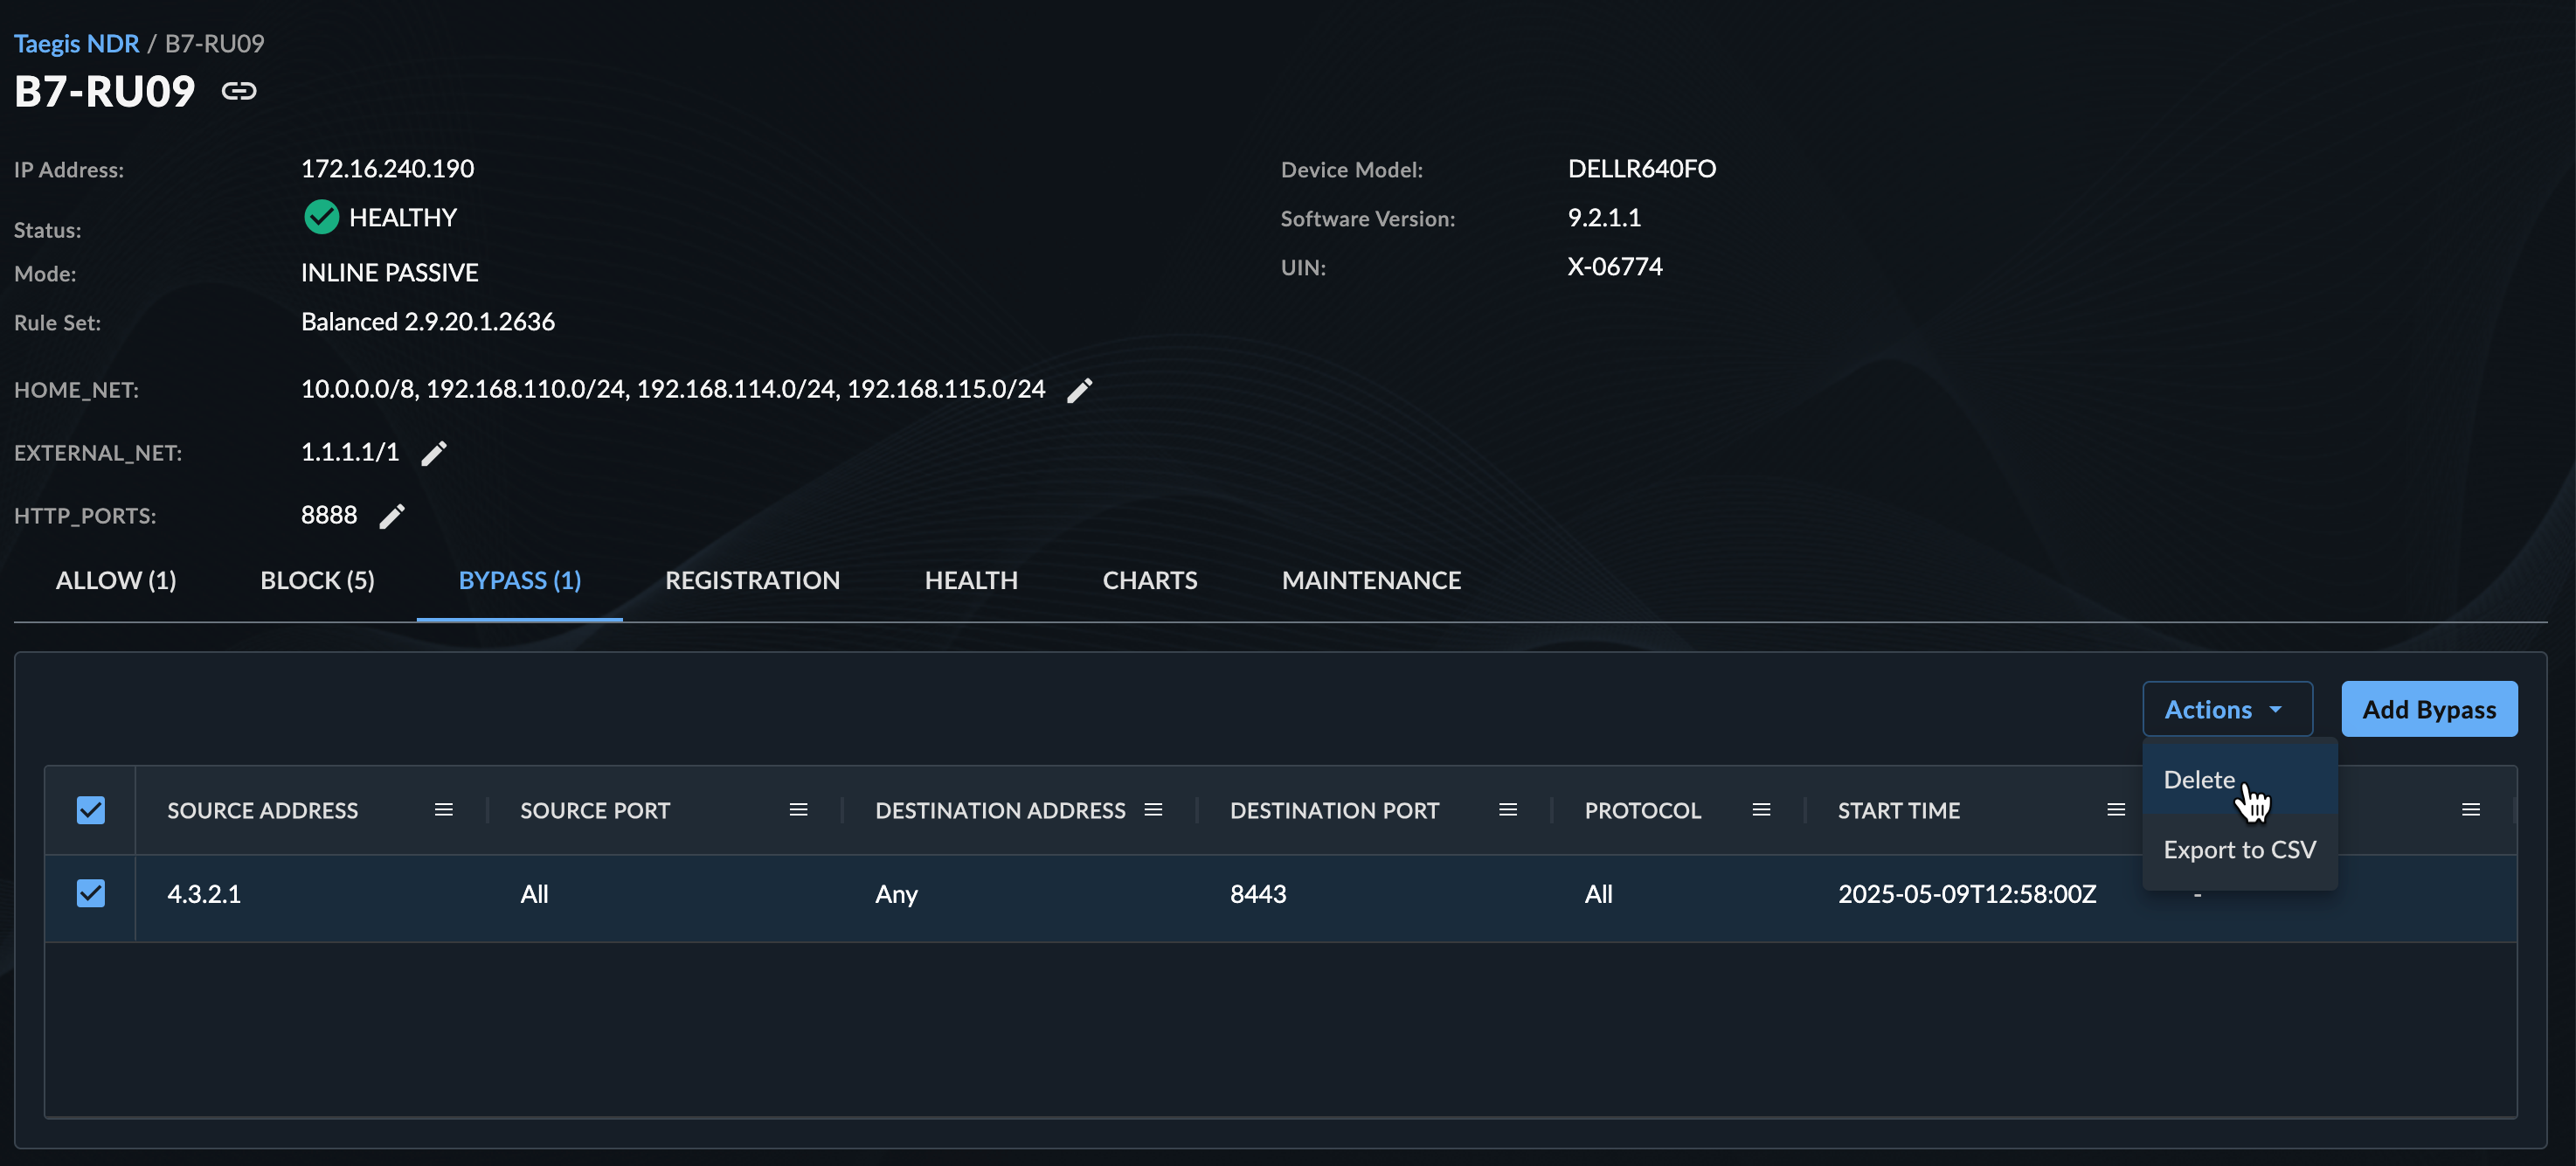
Bypass Tab🔗
Use the Bypass tab to configure firewall rules that instruct the NDR Device to bypass the inspection engine for specified network traffic. When a bypass rule matches, the device forwards the traffic without inspecting or blocking it with the security engine.
Create bypass rules to exclude trusted or high-volume traffic, such as backups or monitoring systems, from inspection. This can improve performance and reduce unnecessary detections.
Actions🔗
Select one or more rules from the list, then open the Actions menu to Delete or Export to CSV the selected bypass rules.
Add Bypass Rule🔗
Follow these steps to add a new bypass rule to the NDR Device:
-
Click Add Bypass. The Add Bypass Rule form appears.
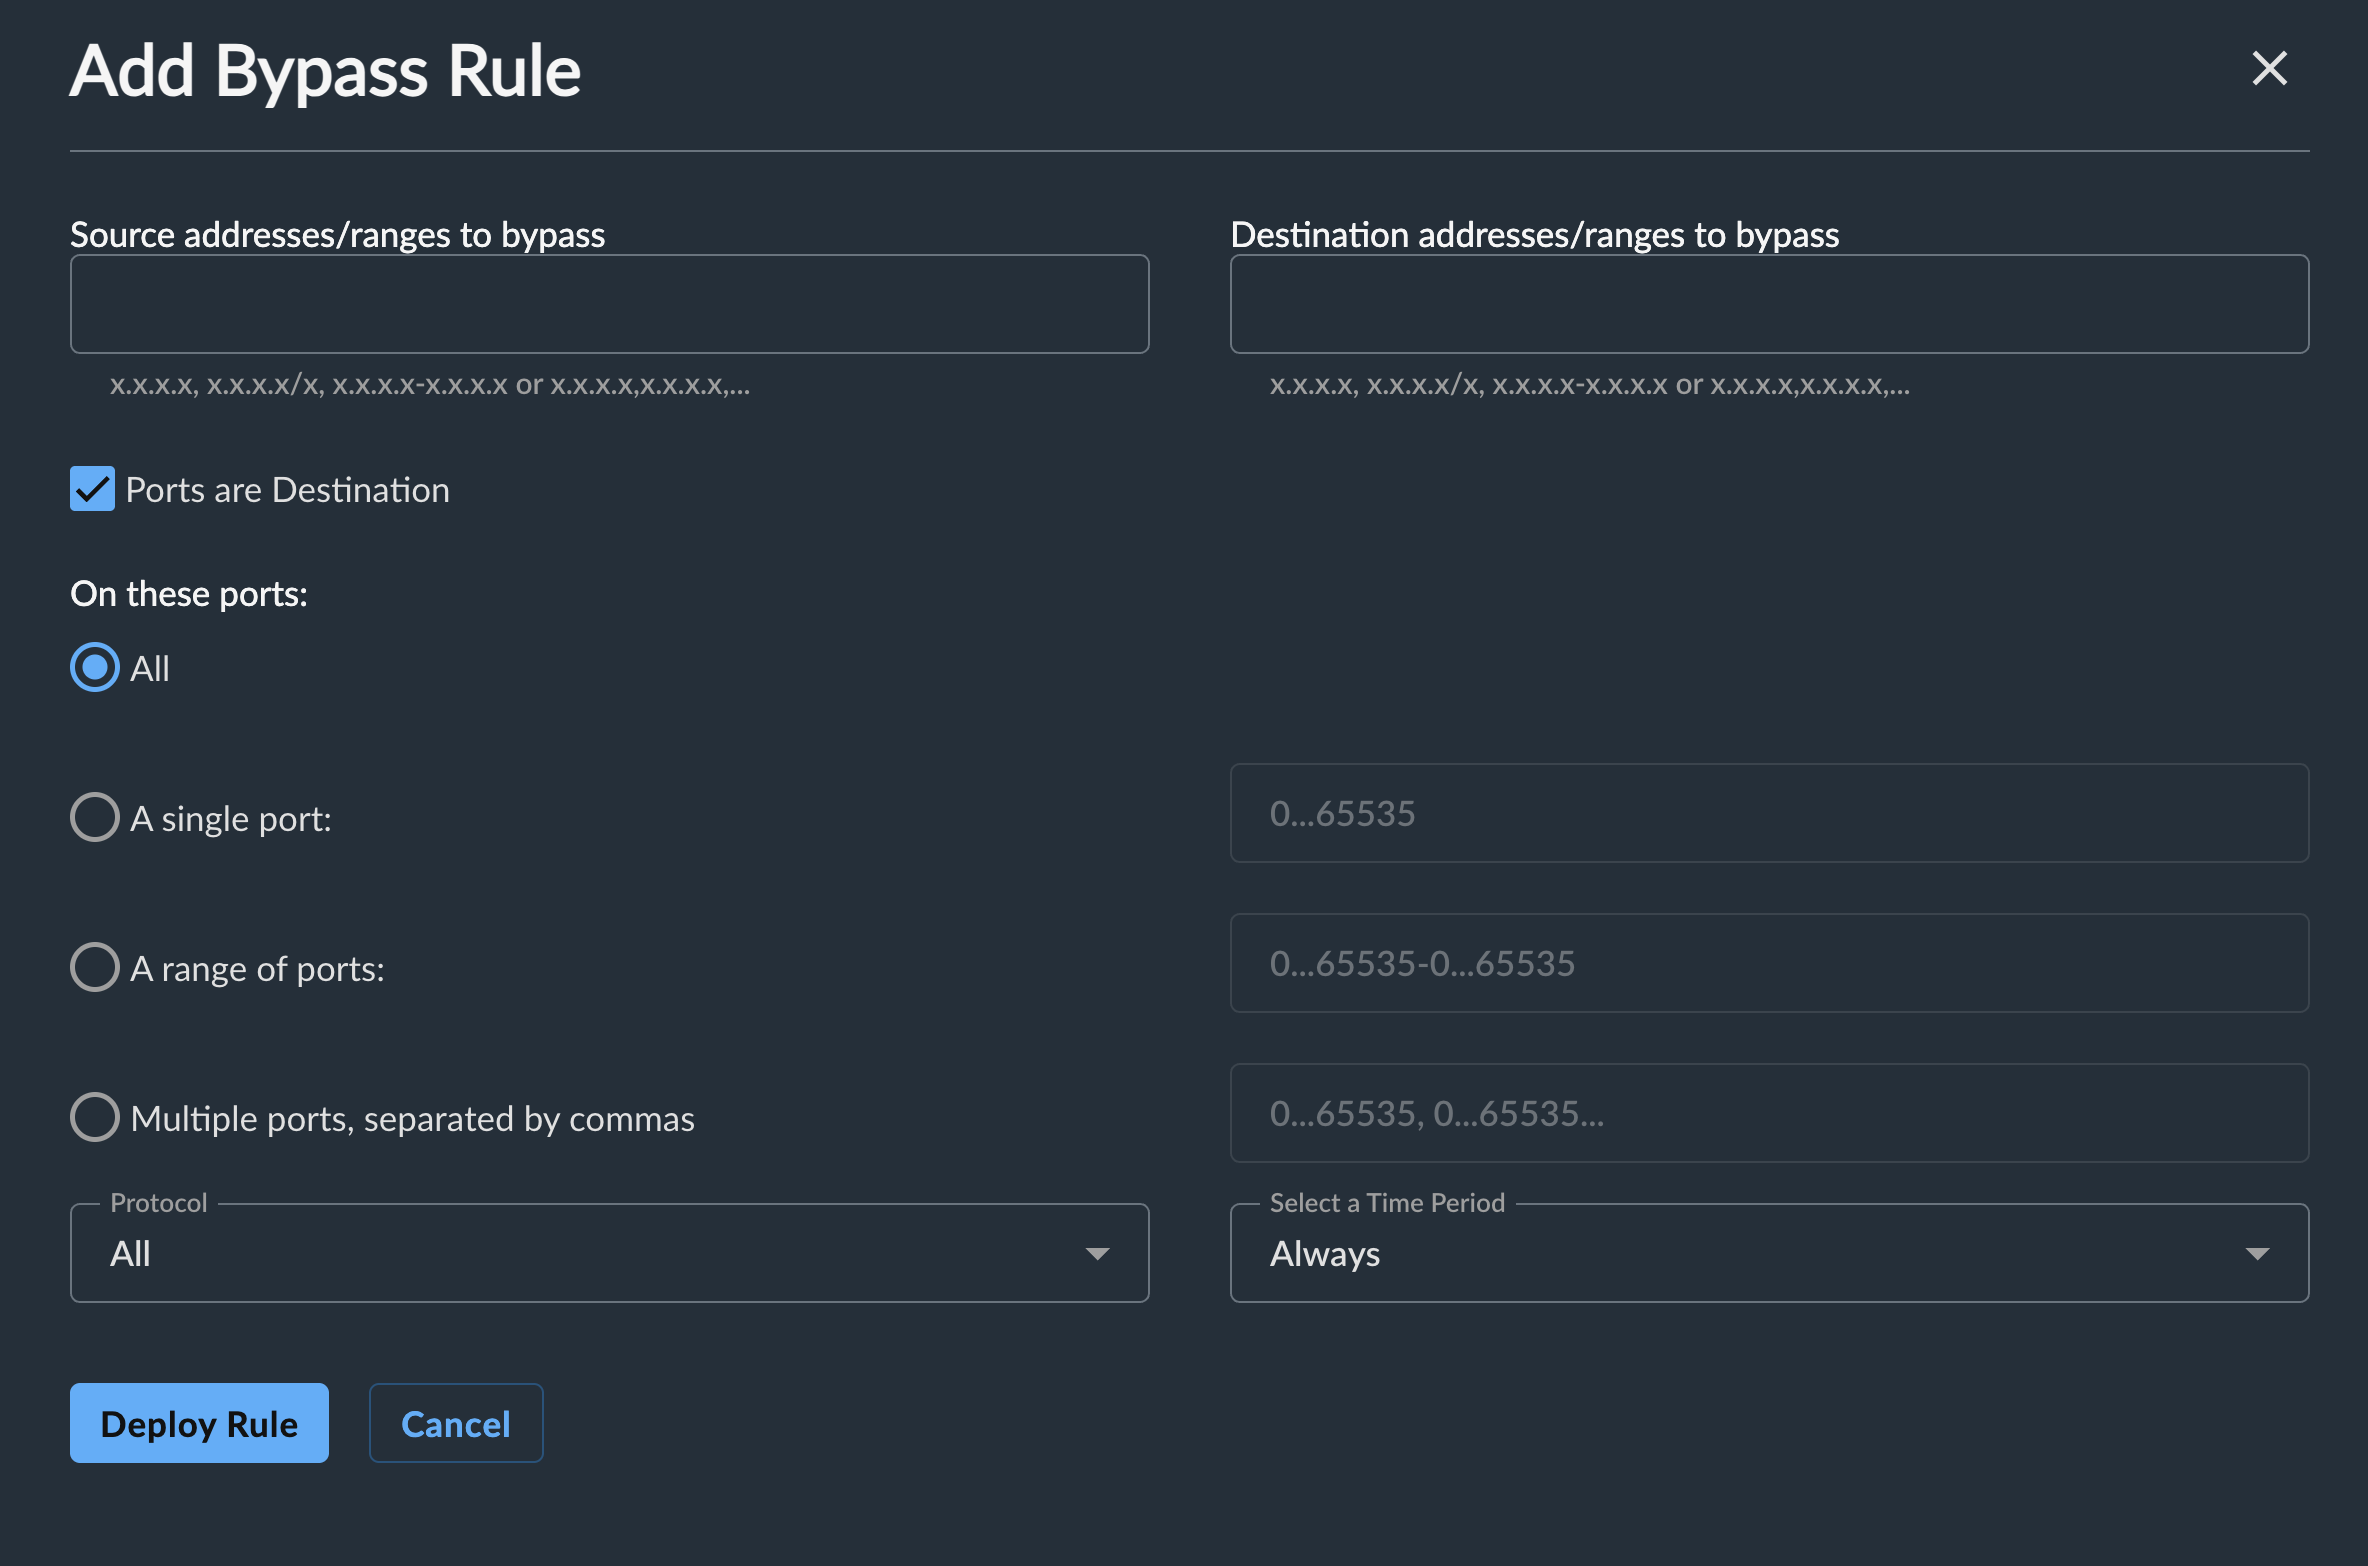
Add NDR Device Bypass Rule -
Enter at least one Source or Destination address or range.
- Leave the Ports are Destination checkbox selected if you want to specify destination ports. Uncheck this option if you want to specify source ports.
- Specify the ports for the rule: choose All (default), a single port, a range of ports, or multiple ports separated by commas.
- Choose the desired protocol, or keep the default (all protocols).
- Select the time frame for the rule to be in effect, or keep the default of always in effect.
- Select Deploy Rule to save and deploy the bypass rule to the NDR Device.
Note
Bypass rules take precedence over Allow and Block rules. When traffic matches a bypass rule, the device does not inspect or block it, regardless of other firewall rules configured on the device.
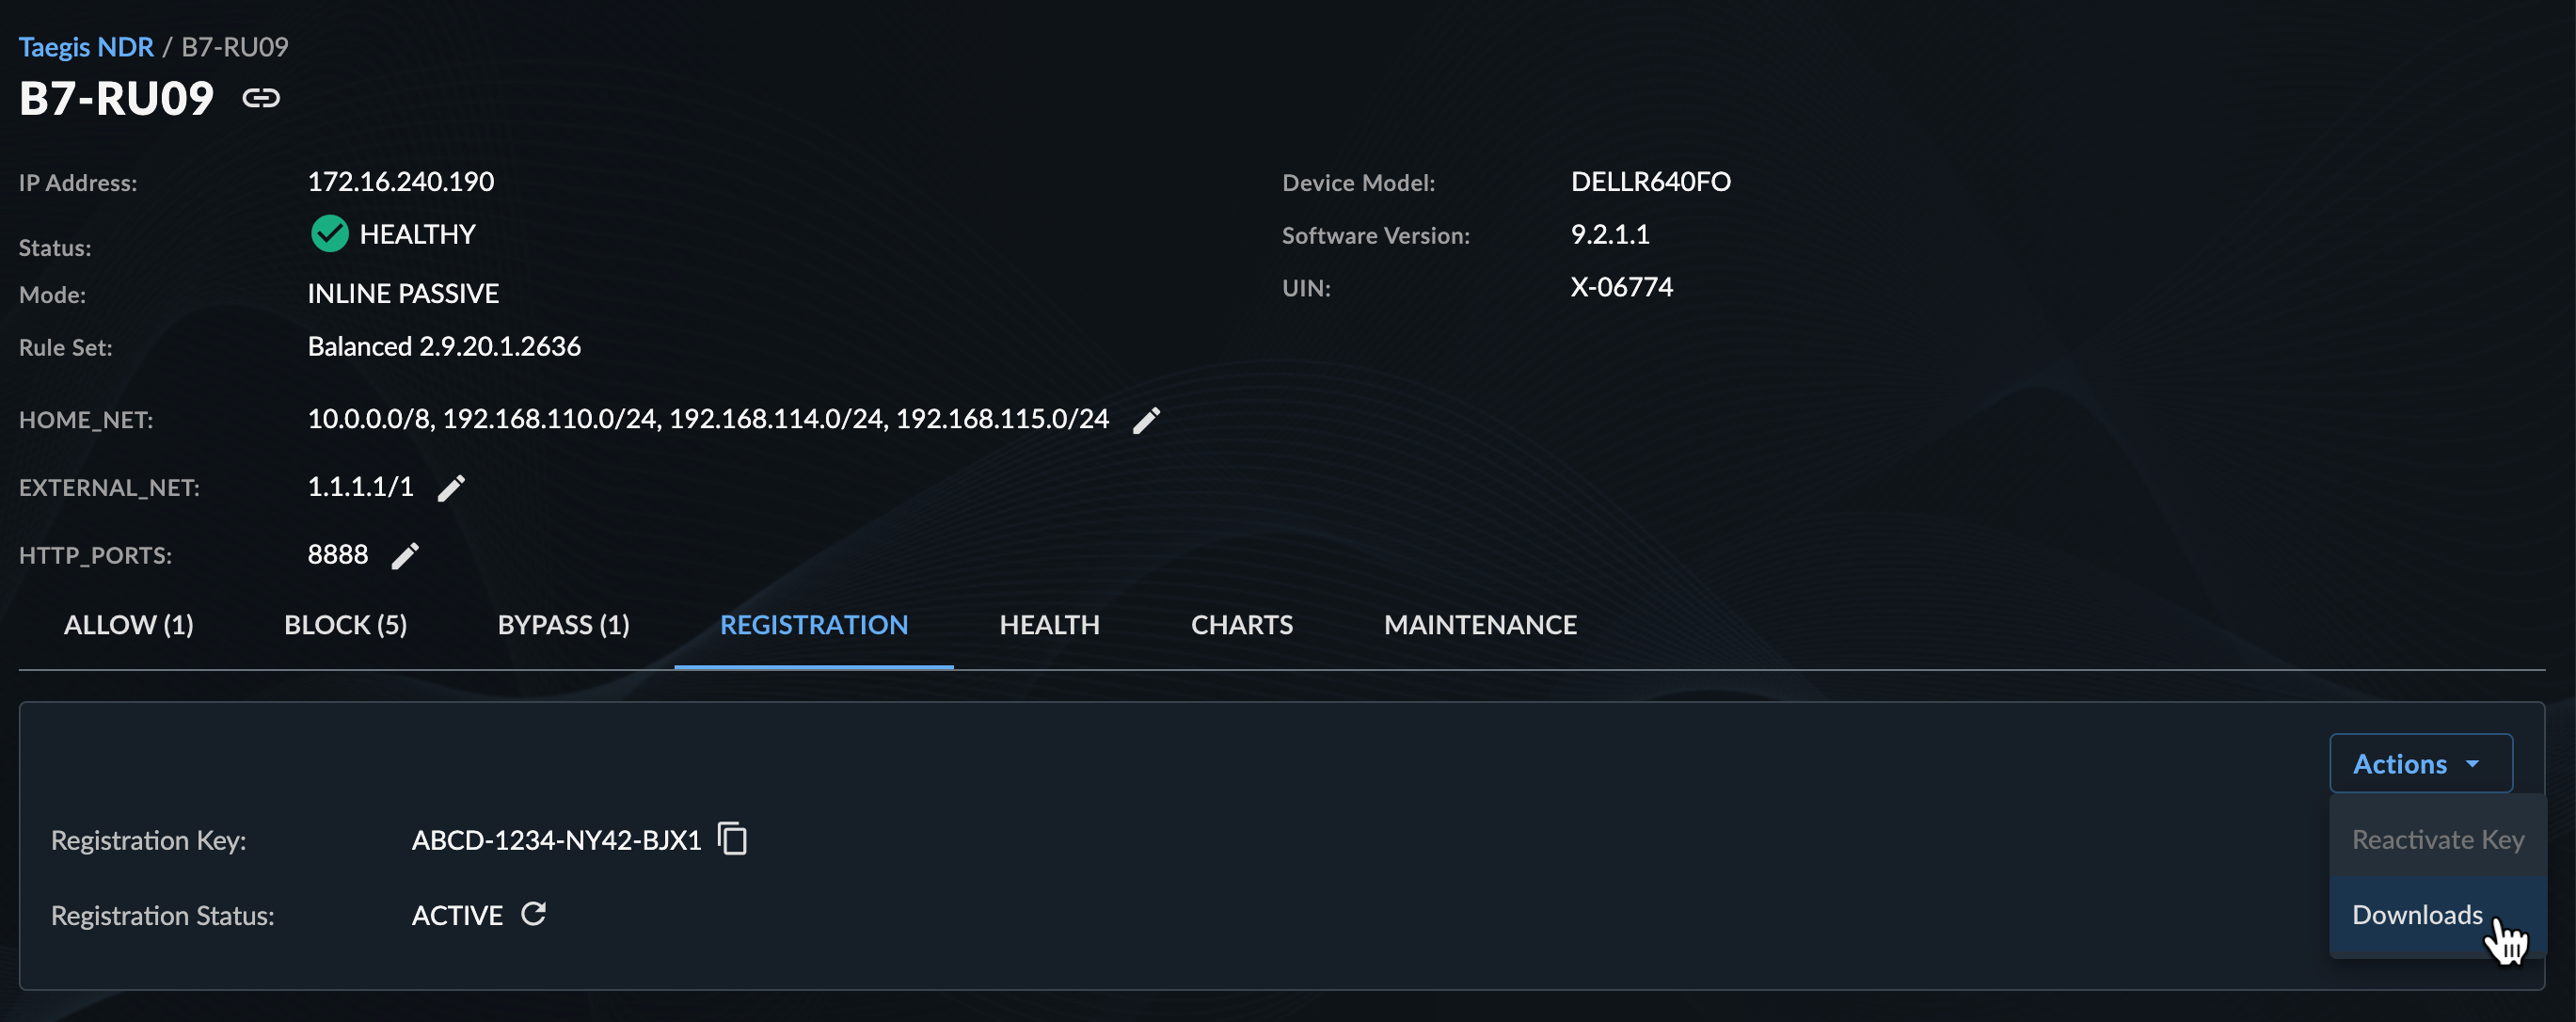
Registration Tab🔗
The Registration tab displays the current Registration Key and the Status of that key.
Actions🔗
- If the key is expired, select the Actions menu and choose Reactivate Key to reactivate the key for use with this NDR Device.
- Select the Actions menu and choose Downloads to download the open source files that are used on the NDR Device, and if the device is a virtual device, the virtual device for setup.
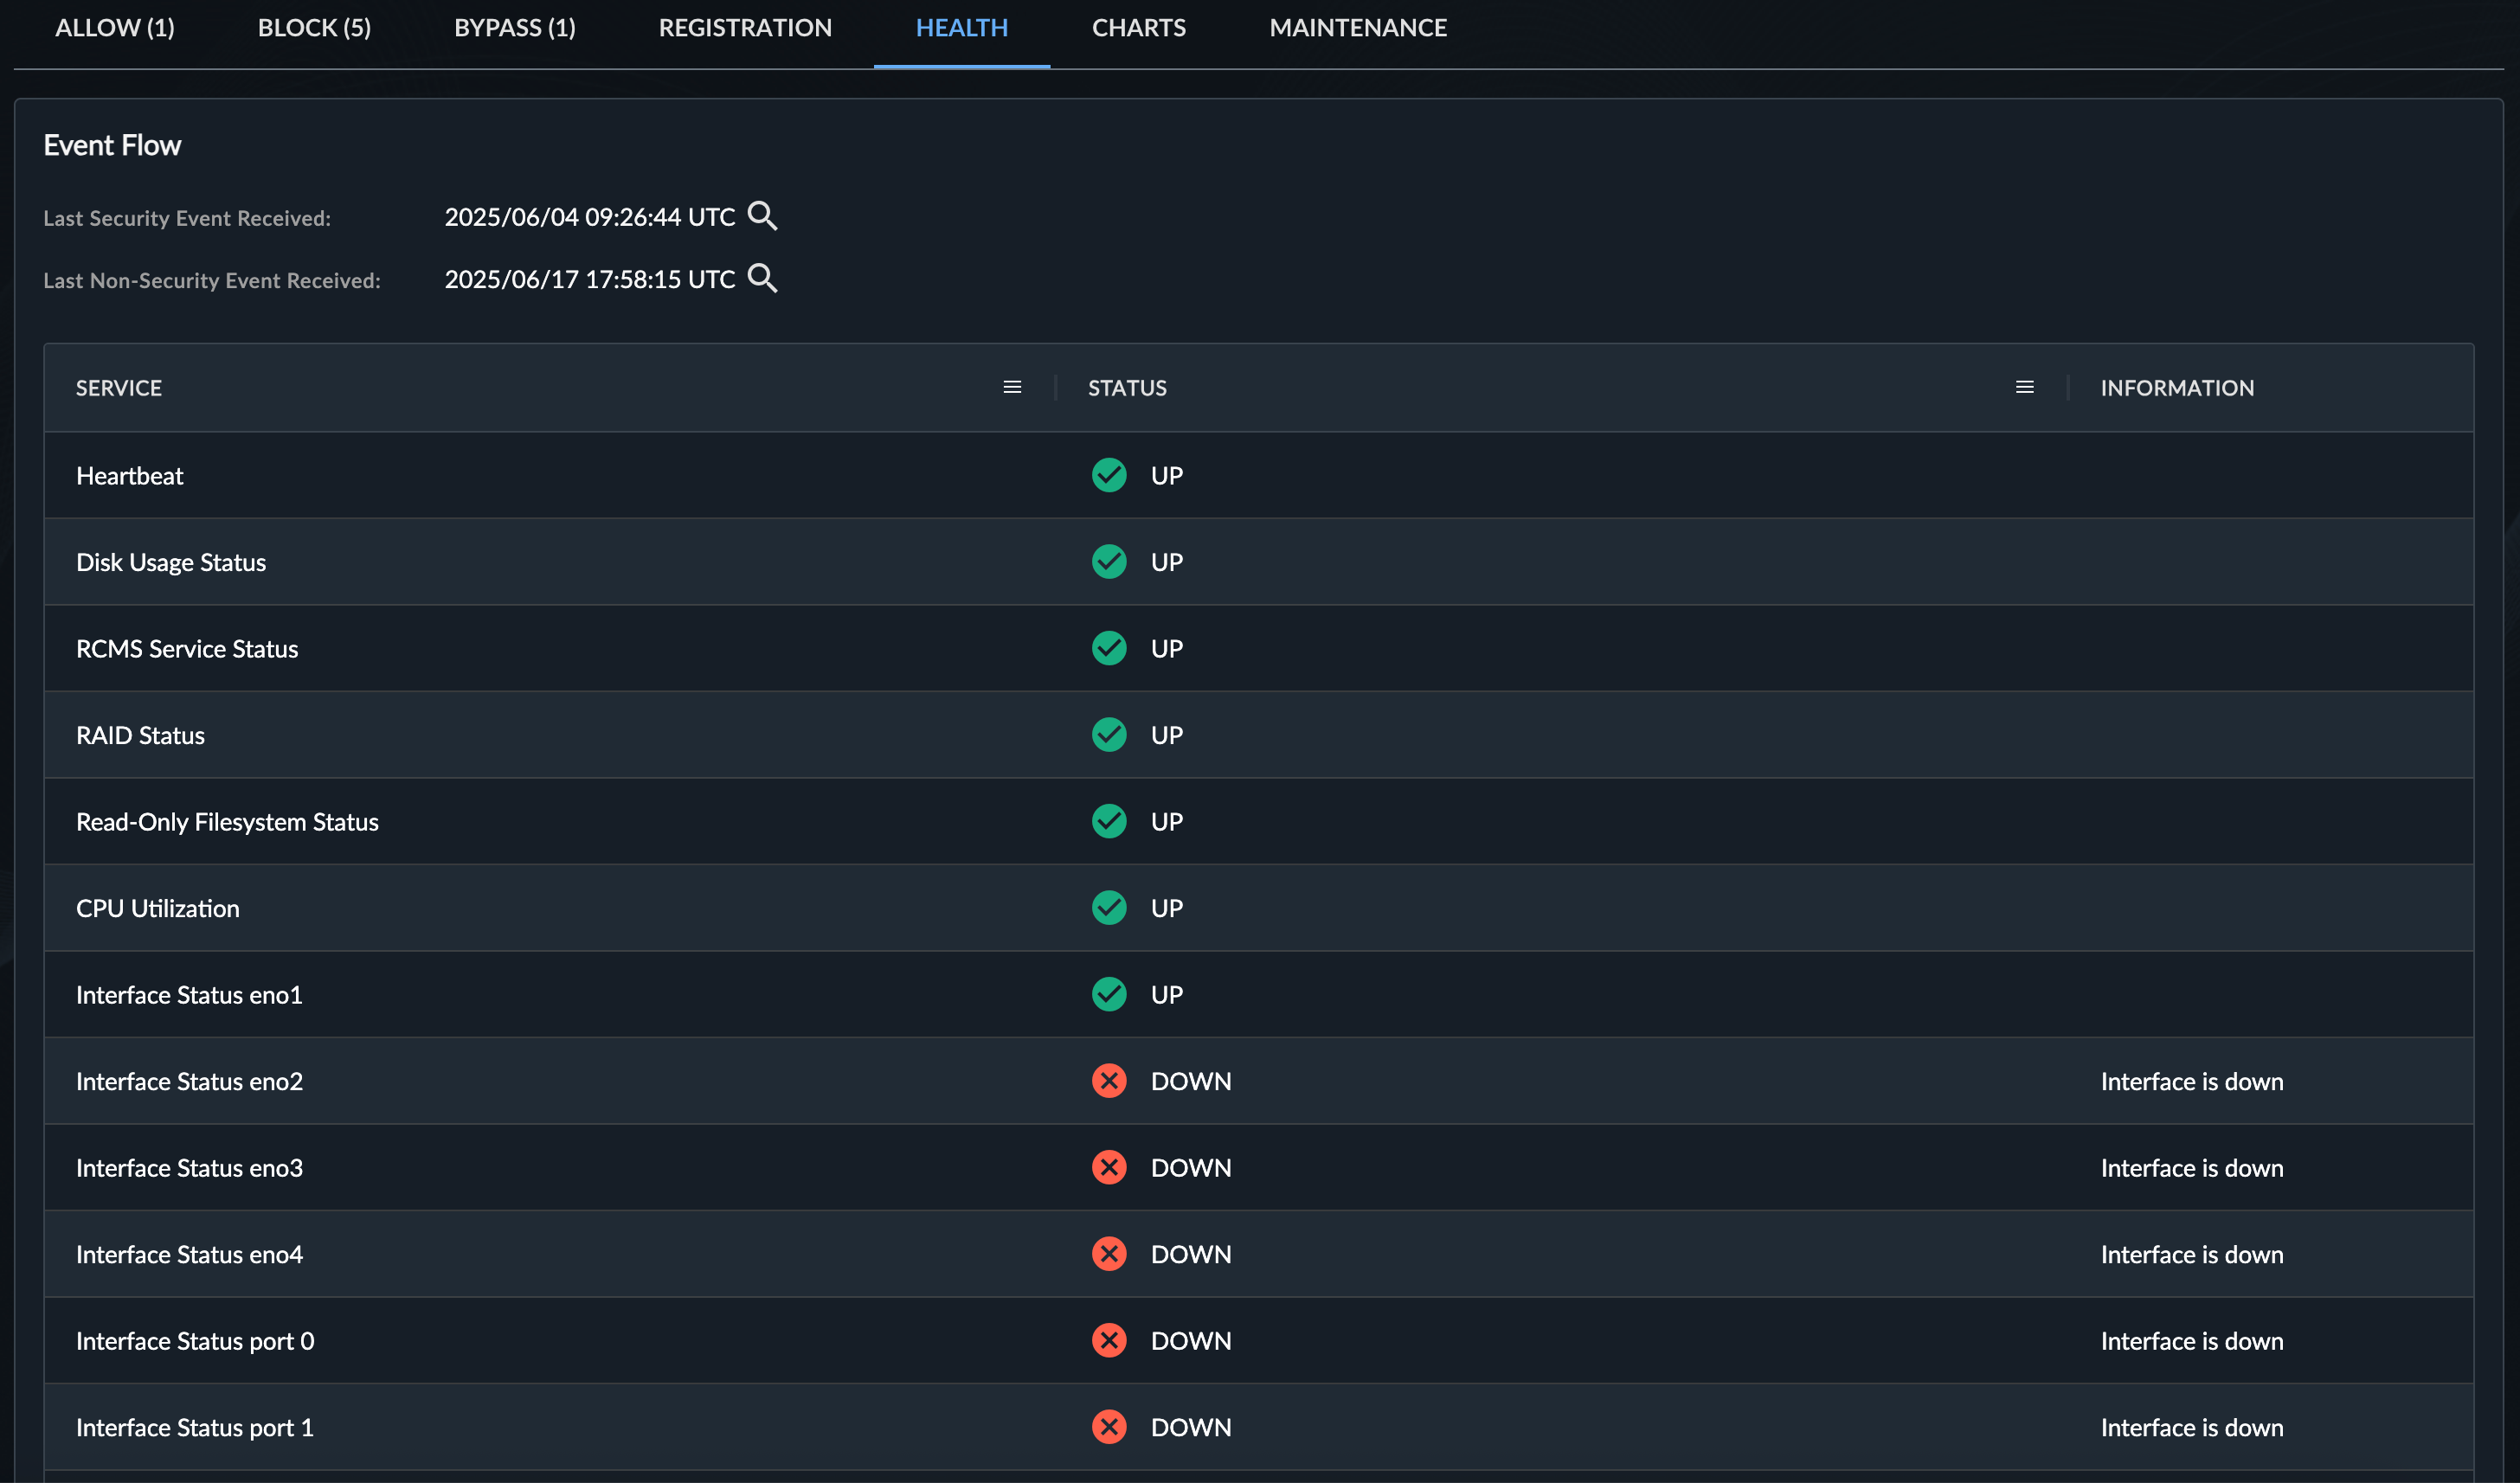
Health Tab🔗
The NDR Device Health tab provides information on the health of the device. This information is presented as statistics gathered from the NDR Device over time with a status of UP or DOWN. If the status is DOWN, the Information column displays explanatory text.
The Event Flow Section at the top of the tab lists the last time a Security Event was received and the last time a Non-Security Event was received from the device.
| Health Check | Description |
|---|---|
| Heartbeat Status | This checks the connectivity from the NDR Device to our backend. The health metrics script in Telegraf only sends a True signal. |
| AttackerDB Feed status | This health check monitors the health of the watchlist update process. The script checks the /etc/cron.d/wl.cron file to verify whether the watchlist cron exist and is in correct format. It checks the modified timestamp of /secureworks/log/sw-wl.log to find when the watchlist update was last triggered. If the watchlist cron is not in valid format or the last update is before 72 hours, then the script will send a DOWN status. |
| Disk Usage | This health check monitors the disk usage of an NDR Device. This will send a DOWN status when disk usage of any partition is detected to be above a certain threshold. The script gathers a list of disk partitions from the device by parsing output from awk '$1~/^\\/dev\\//&& !c[$1]++||$1!~/^\\/dev\\//' /proc/mounts The disk usage is collected by running df -kP and df -iP. The first command will output the size of each partition in 1K blocks (k) in POSIX format (P). The second command is used to check the inode usage of each partition. If POSIX is not supported, uses df -k and stat -c 'FS,%d,%c' -f respectively. If any of the disk usage percentage or inode usage is above 95%, a DOWN status is sent from the script. |
| RCMS Service Status | RCMS is used to remotely manage a device through a series of predefined bash or perl scripts. RCMS is also used in conjunction with PCSMS to deploy snort rulesets and customizations to the device. This health check collects the number of established connections from the NDR Device to the RCMS MQ Servers using the netstat -ptan | grep iRCMSMQRcvd | grep ESTABLISHED | wc -l command. If there is no connection or there are more than one active connections, then the script will send a DOWN status. |
| RAID Status | This health check gathers RAID information for both Physical Disks and Logical Disks and triggers an alert when an NDR Device's RAID configuration is not in an optimal state. Uses omreport storage vdisk | command egrep -i '^ID|^status|^State|^Layout' command to get the details of virtual disk. Uses omreport storage pdisk controller=0 | command egrep -i '^ID|^Status|^State' command to fetch the details of physical disks. This alert is only for R6XX hardware model. The script will send a DOWN status when: virtual drive is not present, virtual drive is not RAID-1 type, or virtual drive is not in 'Ready' state; a drive is missing (there should be two drives/disks for model R6xx devices) or any drive is not in 'Online' state and 'Ok' status |
| NDR Policy Status | This check raises an alert if a supported NDR Device does not have sw.rules included in the snort-rules or if the sw.rules file is not being updated. The script looks at /secureworks/cm/ipsrules7/snort/snort-rules to find an uncommented entry contains sw.rules. This verifies the Secureworks rules are present in /secureworks/cm/ipsrules7/snort/rules/sw.rules. The last modified timestamp is found using stat -c "%Y" /secureworks/cm/ipsrules7/snort/rules/sw.rules. If Secureworks rules are not included in snort or the last modified timestamp of sw.rules file is before 28 days, then the script will send a DOWN status. |
| Read-Only Filesystem Status | This health check monitors whether any disk partitions are mounted as read-only in an NDR Device. This will send a DOWN status when at least one disk partition is mounted as read-only. The script gathers a list of disk partitions and mount options from the device by parsing output from awk '$1~/^\\/dev\\//&& !c[$1]++||$1!~/^\\/dev\\//' /proc/mounts. It skips the partitions which are marked as ro in /etc/fstab. |
| CPU Utilization | This health check monitors average CPU utilization of an NDR Device. This will send a DOWN status when average CPU usage is detected to be above a certain threshold. The script gathers CPU metrics from the device by parsing output from /proc/stat over a short interval. Measures the number of jiffies (1/100 of a second for x86 systems) that the system has been in user mode, user mode with low priority (nice), system mode, idle task, I/O wait, IRQ (hardirq), and softirq respectively. To find the recent usage the difference between total CPU usages taken in two seconds interval is used.awk '/cpu /' /proc/stat; sleep 2; awk '/cpu /' /proc/stat cpu 408944292 30628 131584823 2299538736 312920 135090540 496720 0 0 0 cpu 408944506 30628 131584898 2299539950 312920 135090606 496720 0 0 0The fourth value in the output is idle time and the percentage of remaining values collectively gives the CPU usage. If the CPU usage is greater than 80%, a DOWN status is sent from the script. |
| Dell OpenManage Status | This health check monitors the health of hardware using the Dell omreport command. This works only for Dell hardware and with omreport software installed. The command /opt/dell/srvadmin/bin/omreport chassis -fmt ssv gives the health severity of different hardware components. The check looks for these components: Fans, Intrusion, Memory, Power Supplies, Power Management, Processors, Temperatures, Voltages, Hardware Log, Batteries. If any other component is found in the result, the script will send a DOWN status. In the above components, if the Memory component severity is anything other than OK or UNKNOWN, then the script will send a DOWN status. |
| NDR Management Redundancy | NDR Devices have redundant connection to Secureworks VPN infrastructure, tun0 and tun1. This is commonly referred to as Dual Data Center (DDC). If one of these connections is down, the device will still be able to communicate with our backend without issue, but we would lose redundancy. This health check collects the list of interfaces with status using the ip -s link command. If either tun0 or tun1 is down, then the script will send a DOWN status. |
| NDR Snort Status | This checks the NDR Device's packet inspection capabilities. If it is not running, monitor mode NDR Devices are in a service outage and inline NDR Devices are in full outage. This health alert checks the status of the IPS process (snort). It uses the svstat /service/ips command to check if the service is running and the second it is up. If the running time is less than 300 seconds, the service is assumed as recently restarted (is_flapping). If the service is not running or is_flapping, a DOWN status is sent from the script. |
| Certificate Status | This health alert checks the expiration date of the NDR Device certificate (/secureworks/certs/Certificate.pem). If the expiration is within the next 72 hours, a DOWN status is sent from the script. |
| NDR Syslog Health | This health alert checks the status of the syslog process. It uses the pidof command to check if the service is running. The script first checks if syslogd process is running. If not, it will check if rsyslogd is running. It calculates the up time of the service in seconds using the process start time from ps -C rsyslogd -o lstart=. If the running time is less than 300 seconds, the service is assumed as recently restarted (is_flapping). If the service is not running or is_flapping, a DOWN status is sent from the script. |
| Time Offset Status | This health alert check is for monitoring the time sync between NTP server and the device. It will trigger an alert if the time difference is higher than the threshold. On v9 NDR Devices, we are now running a version of NTP called chronyd. We check if the chronyd service is running or the system time offset is < 15 seconds and a DOWN status is sent from the script if either condition succeeds. |
| Telegraf Config Status | This health alert checks whether the Telegraf config update periodic process is running successfully and the applied config version is up to date. To check whether the Telegraf config update periodic process is running successfully, the modified timestamp of /secureworks/log/sw-health-conf-check.log file is checked. If the file is not modified in the last six hours, then the update periodic process is not running. The latest config version available in S3 is stored in /var/telegraf/configs/latest_version_on_s3. If this version is not the same as the version in symbolic link of /var/telegraf/etc, then the applied config version is not up to date. If either of this is true, a DOWN status is sent from the script. |
| Duplicate Host Status | If a host is found on the network with the same IP address as the NDR Device, this is indicated in the status. |
| NDR Acme Agent Status | Acme provides access to the NDR Device. This alert indicates the status of the Acme agent on the NDR Device. |
| NDR Log Upload Status | The Log Upload service posts the logs from the NDR Device to our data lake. This alert indicates the status of the Log Upload on the NDR Device. |
Charts Tab🔗
The NDR Device Charts tab provides visualizations of the following key device performance metrics:
- Memory Usage
- CPU Utilization
- Disk Usage
- Network Interface Errors
- Network Interface Packets
- Network Interface Throughput
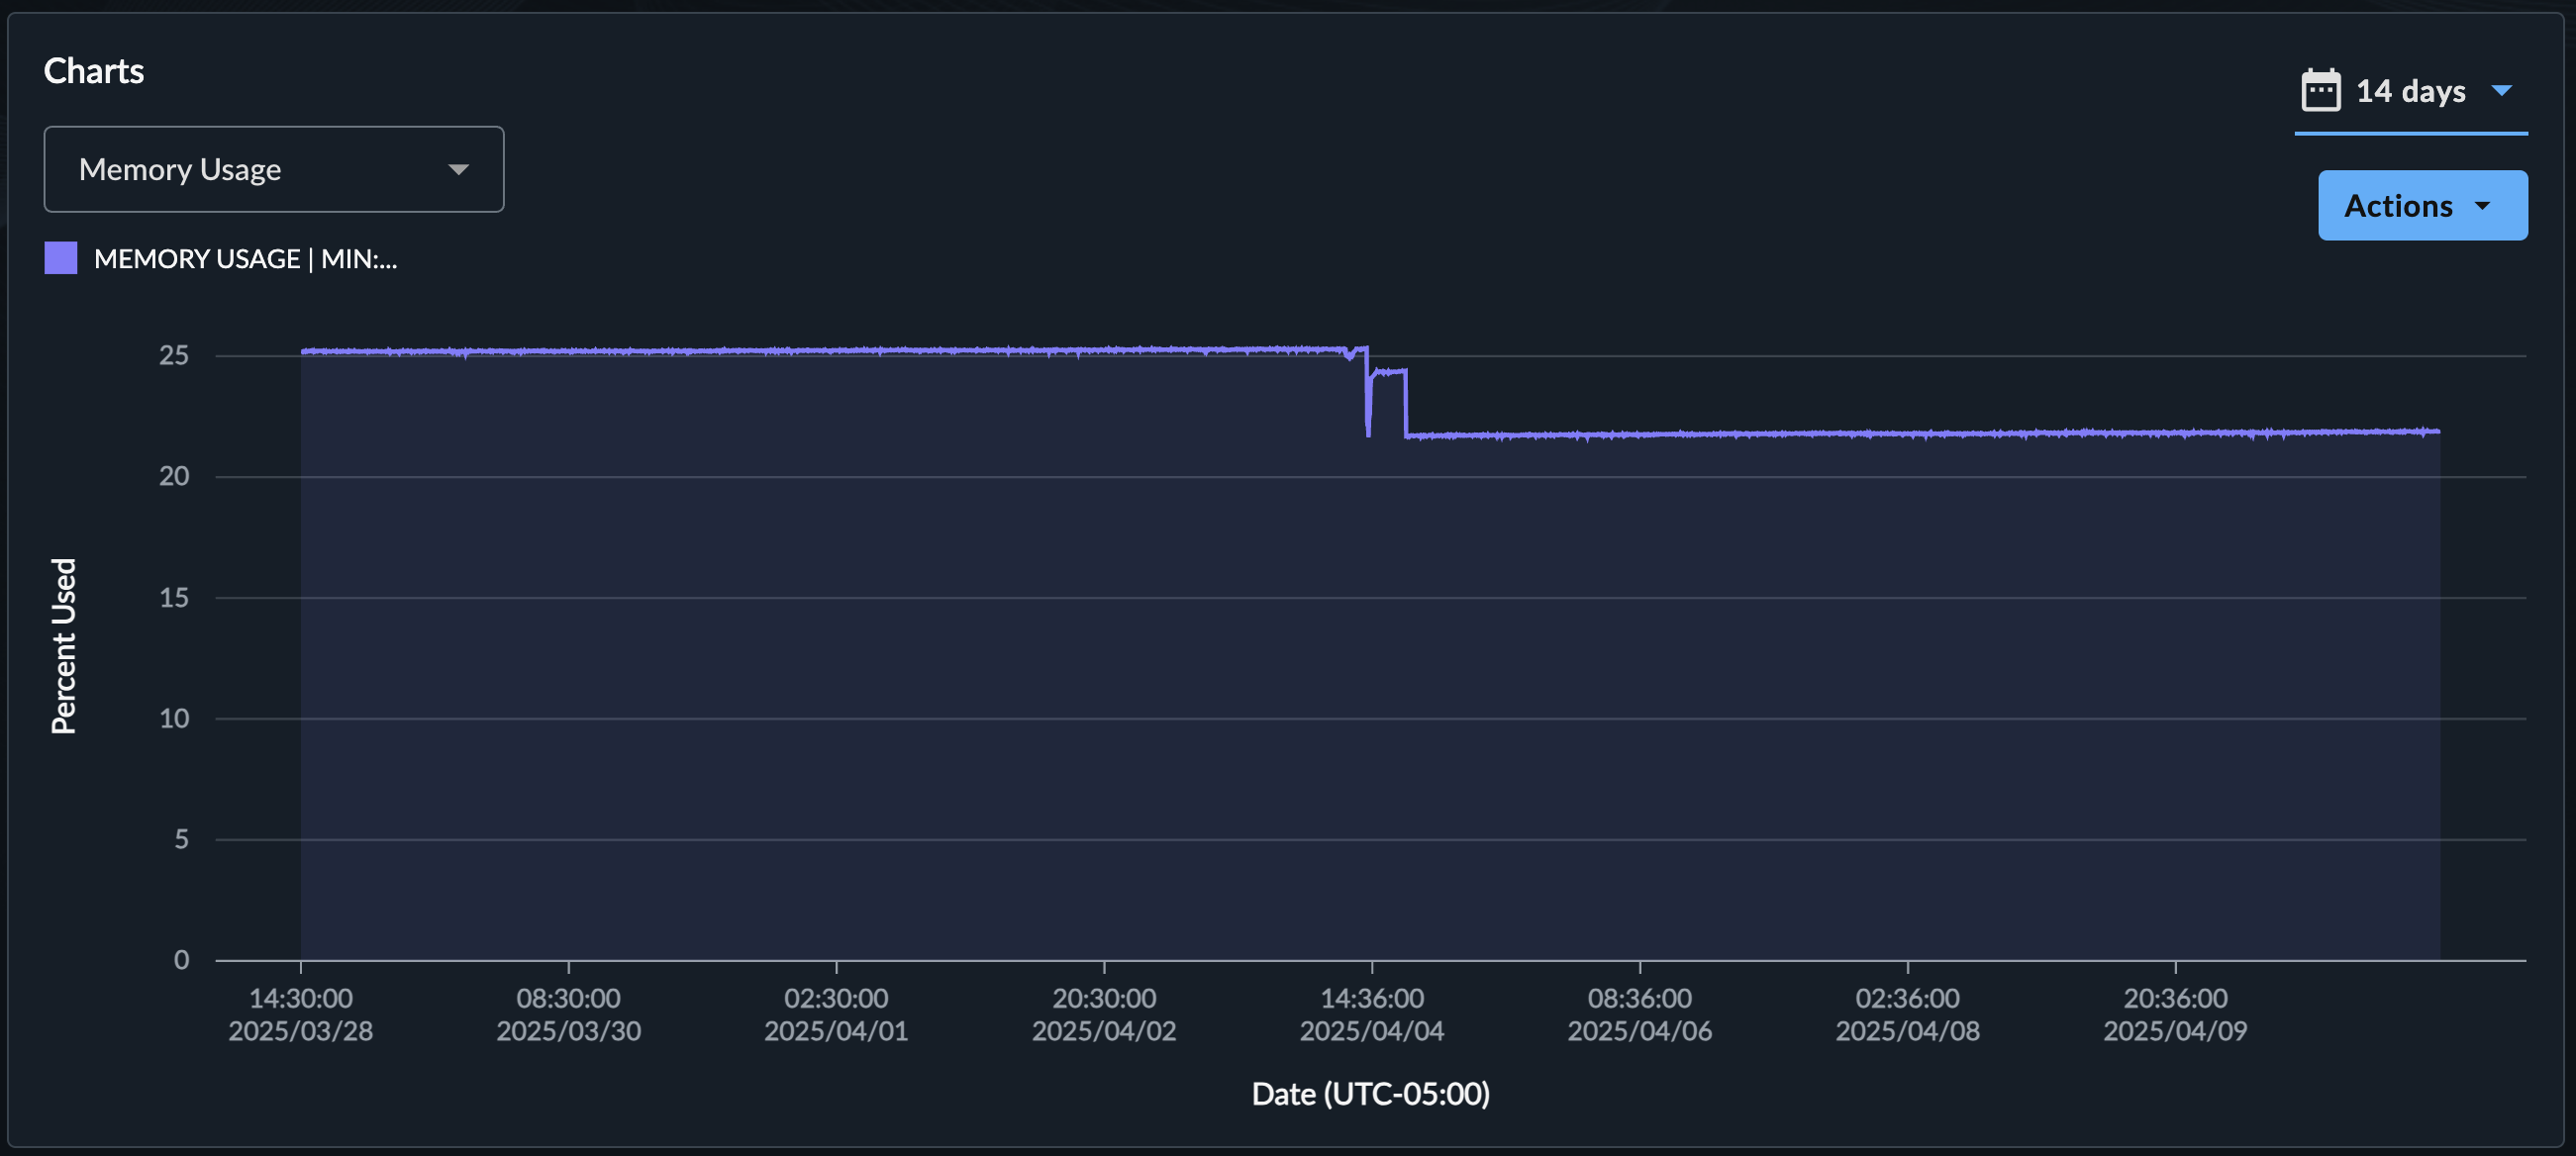
The following options are available:
- Select the type of chart you want to display from the dropdown menu at the left side of the tab.
- Select the date range picker from the right side of the tab to adjust the range used by the chart.
- Hover over data points in the chart and legend to view more details.
- Select and deselect items from the legend to adjust the chart.
- Select the Actions menu to download the chart as a .png file.
Maintenance Tab🔗
The NDR Device Maintenance tab provides information on upcoming and completed service maintenance and allows you to configure a maintenance window that fits your schedule for future maintenance.
Service maintenance involves software updates to your NDR Device which may sometimes cause very brief interruptions in traffic flow on your network. All software updates — both the minor service maintenance as well as the rare major system upgrades requiring a reboot of your NDR Device — will be shown here along with a thorough explanation of their content.
Important
We recommend you choose a maintenance window during a minimally disruptive period and at a time you are available to handle potential issues.
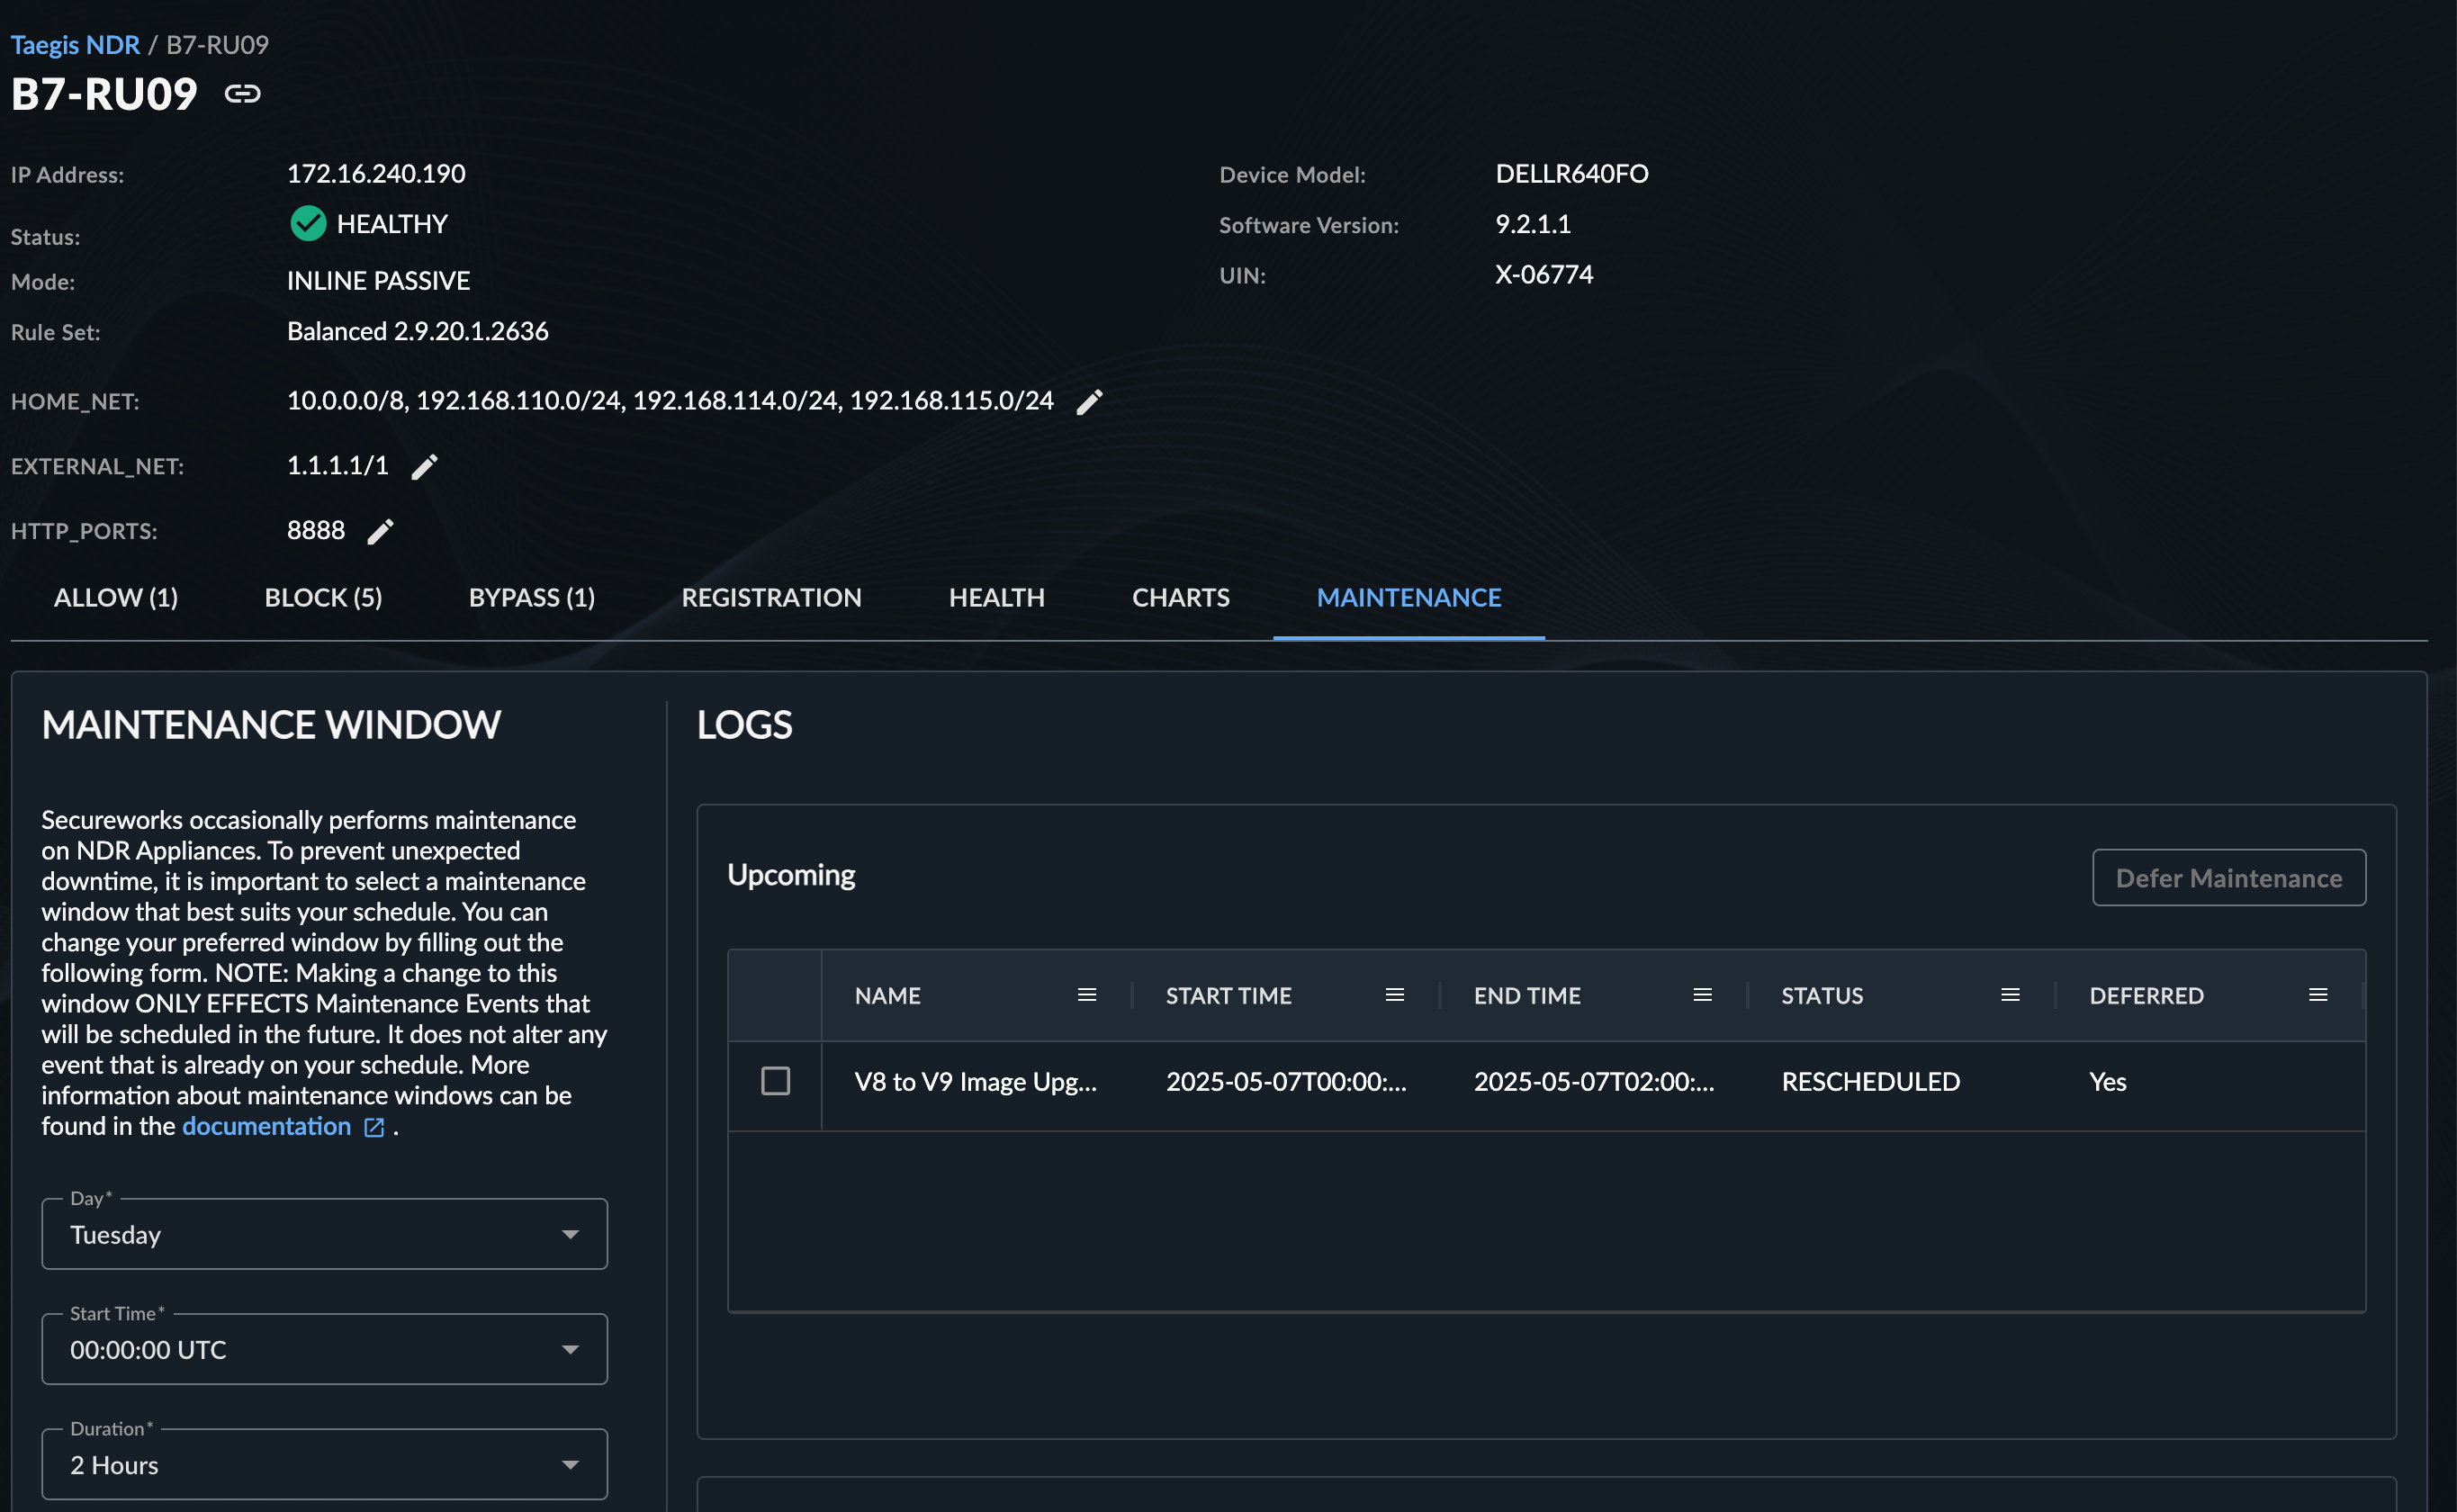
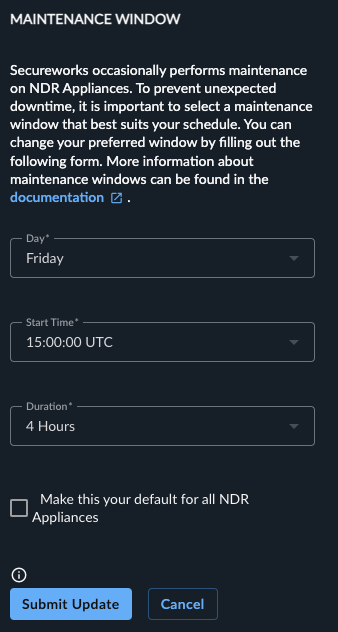
Configure a Maintenance Window🔗
The Maintenance Window pane at the left of the Maintenance tab allows you to specify a preferred window for service maintenance. This pane also allows you to set the default value that will be in place for any of your NDR Devices that you do not specifically customize. To submit a maintenance window:
- Select the preferred day of the week for service maintenance from the dropdown menu.
- Select the preferred start time in UTC.
- Select the preferred duration.
-
Decide if you want this particular window definition to become your Default Maintenance Window. Your Default Maintenance Window is the window that will be used for any device that you have not specifically customized. To apply this setting, select the box Make this your default for all NDR Appliances.
Note
If you have previously customized devices, this default value will not override what you set up for those devices.
-
Choose Submit Update.
Alterations to these settings can be made at any time. However, note that this only applies to changes not yet scheduled. Once maintenance is scheduled, updating the maintenance window will not affect it. If the device is unhealthy or inaccessible during the scheduled maintenance period, the maintenance operation will not take place.
Logs🔗
The Upcoming Logs table displays details such as the Name, Start Time, Health Status, and the Deferred state of upcoming service maintenance. Each upcoming maintenance can be deferred once by selecting the checkbox for the row and choosing Defer Maintenance. This action delays the Start Time to the next available maintenance window, based on the day set in the Maintenance Window pane.
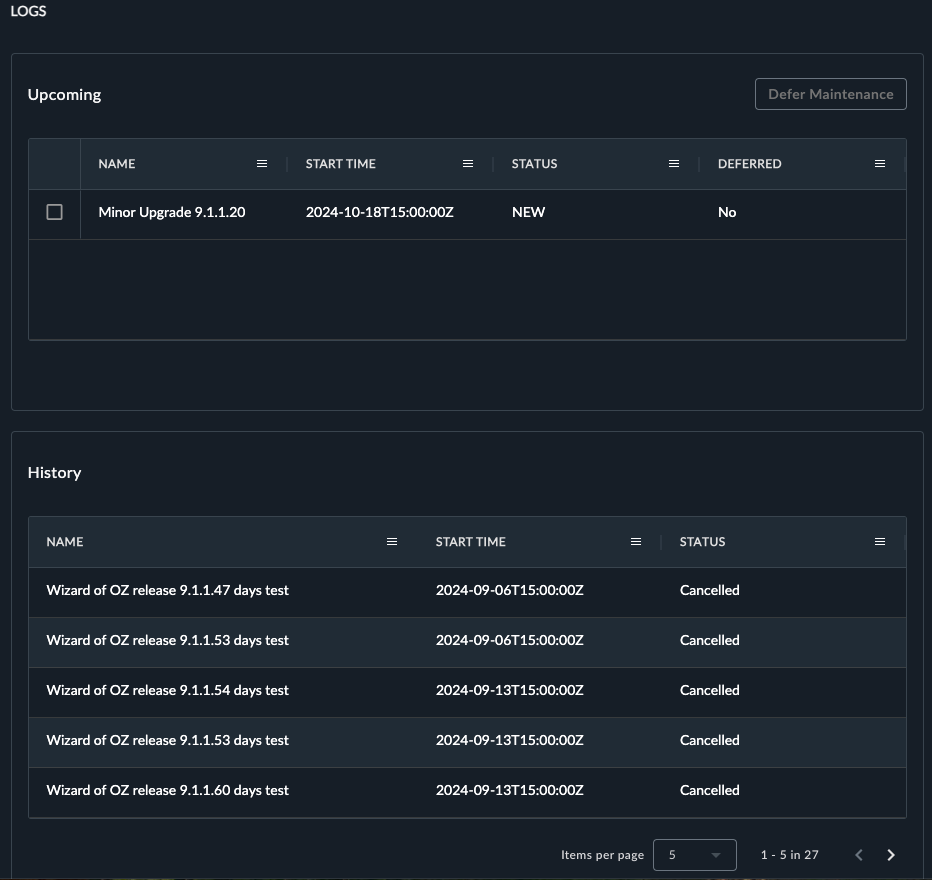
For example, the screenshot in the preceding section shows a weekly window start time of Fridays at 15:00:00 UTC, and the Maintenance Logs screenshot above shows upcoming maintenance scheduled for 2024-10-18T15:00:00. Deferring this will move the maintenance to the next week, 2024-10-25T15:00:00.
If the day in the Maintenance Window pane is changed to Tuesday at 15:00:00 UTC prior to deferring the maintenance, then the deferred window will be less than one week later and will be scheduled for 2024-10-22T15:00:00, as this would be the next available maintenance window for the device.
The status of Upcoming maintenance may be one of the following:
- New — Maintenance has been scheduled.
- Rescheduled — This is a maintenance event that was either deferred by your action, or could not be done at the originally scheduled time. Because it is rescheduled, it cannot again be deferred.
The Logs History table displays records of previous device service maintenance, including information on the maintenance Name, Start Time, End Time, and Status. Possible statuses for maintenance history include:
- Complete — The maintenance was completed successfully.
- Failed — The maintenance was not successful, and the device has been restored to its previous state. Failed maintenances are monitored by Secureworks, and any impediments to successful maintenance are remedied before rescheduling.
- Cancelled — Either the Defer button was used to delay this maintenance, or the event was cancelled by Secureworks.
Maintenance Notifications🔗
XDR uses various methods to communicate upcoming maintenance to users.
- Email and In-App Notifications — The Upcoming NDR appliance maintenance option in the Health Status section of Notification Preferences notifies all users via email and through the XDR in-app notifications about upcoming maintenance.
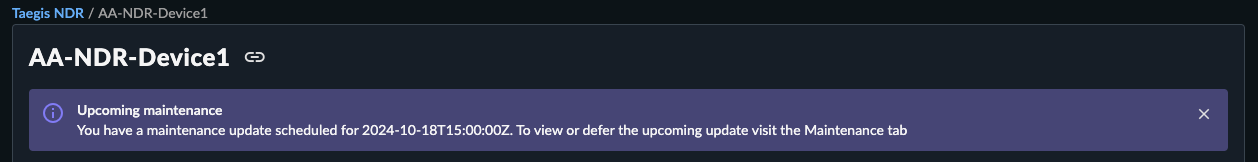
- NDR Details Maintenance Banner — For devices with scheduled maintenance, an information banner displays on the NDR Details page, irrespective of the time remaining until the scheduled maintenance or individual notification preference.
Service Maintenance FAQ🔗
What qualifies as service maintenance?🔗
Service maintenance involves any upgrade to software on your NDR Device. Typically these are minor version upgrades to the software being run on the device. On rare occassions, it will include OS level updates and may require a reboot. Maintenance requiring a reboot will be called out specifically, but these are rare.
How often does service maintenance occur, and why is the maintenance window set on a weekly basis?🔗
Service maintenance is not a weekly occurrence. The weekly maintenance window is established to provide a consistent timeframe that minimizes disruption when maintenance is necessary. This does not imply that maintenance is conducted every week, but rather that there is a designated time slot available for when it is required.
Is there a risk of a network interruption during service maintenance?🔗
Some maintenance updates include updates to the software being used to read and analyze the network traffic coming from the wire. Sometimes these components must be restarted in order to put the new software into action. Though every effort is made to divert your network traffic during these restarts so that there is no detectable outage, sometimes a short "blip" may be noticed.
How will I be informed about upcoming service maintenance events?🔗
You will receive notifications about upcoming service maintenance if you are subscribed to receive Upcoming NDR appliance maintenance in the Health Status section of Notification Preferences. When this setting is enabled, you will receive an email notification starting one week prior to the scheduled maintenance, providing ample time to prepare for the event.
What are the safeguards in place if an issue arises during scheduled service maintenance?🔗
Our system is designed with multiple safety measures to mitigate risks during scheduled service maintenance. On each device, there are preflight checks to ensure it is in a healthy state. If the system proceeds with the maintenance and encounters any critical issues, it is designed to perform an automatic rollback. In the rare case that the device becomes unresponsive, you will be notified of the device's status in the same manner as you would in any other situation where the device encounters an issue.